MX340 Print Head Maintenance Assembly Underside

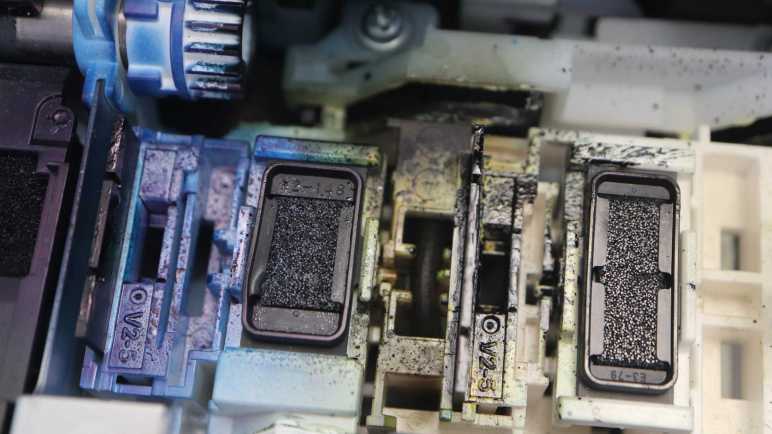
I don’t know what’s involved in maintaining an inkjet cartridge, but I’m learning bits and pieces by poking around inside my retired Canon Pixma MX340 multi-function inkjet. I saw where the print head would rest when in its parked position, and thought the rectangular block of material sitting underneath the print head would be something soft and spongy to absorb excess ink. I was surprised when I poked at it with a cotton swab and found it was rigid. Interesting! Now I’m even more curious and want to see the rest of this maintenance assembly.

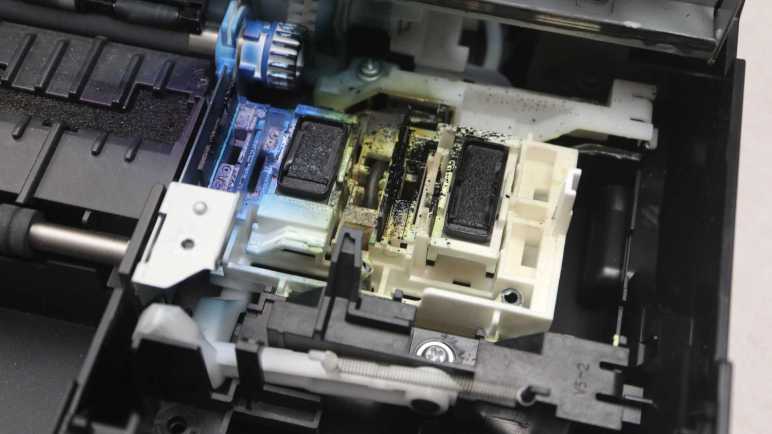
Looking at how its multiple parts interlocked, I came to the conclusion this one screw holds down everything on front side of this assembly. Removing the screw allowed this piece of plastic to slide aside and be removed.

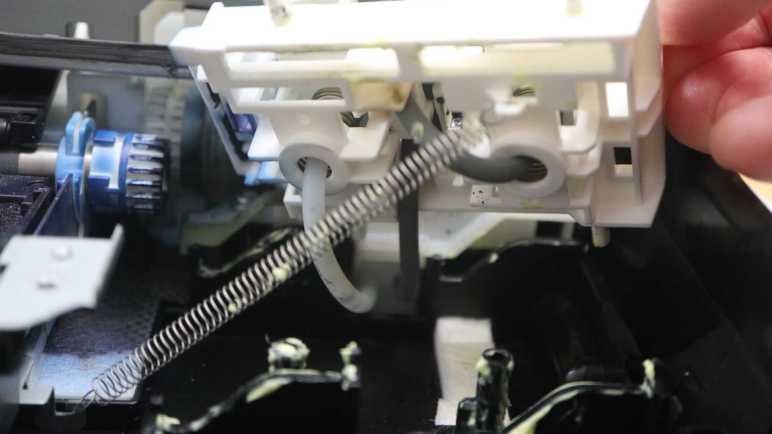
This assembly hosts the latch that makes the wiper blades work, and it covers one side of the up-and-sideways track for the maintenance assembly allowing me to flip it up.

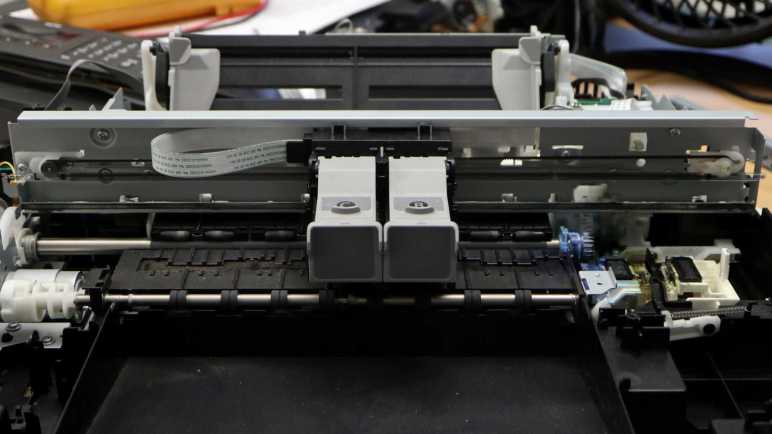
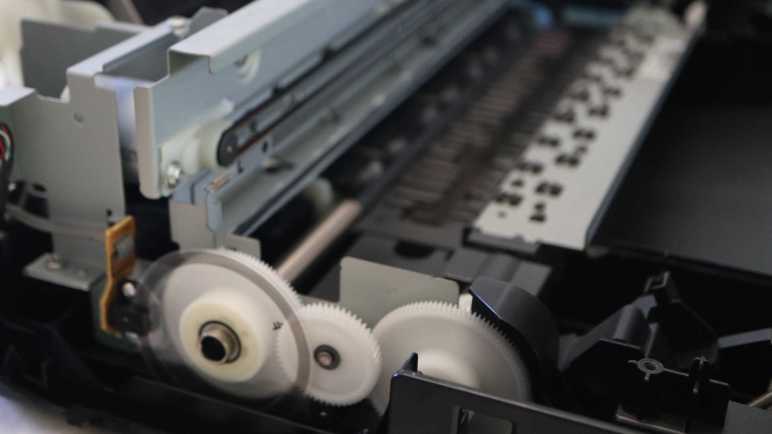
Now I can see the motion mechanism in its entirety. There are four tracks to guide this assembly as it moves 45-degrees up and then right, and in the foreground of this picture is the retraction spring pulling it down and left.

Each ink cartridges sit over a spring-loaded assembly with a tube in the middle. These springs push the pliable rubber surrounding the not-sponges to form an airtight seal that keeps the ink drying out. The tube going into the black ink assembly on the right is much longer, snaking up to the top of the assembly before coming back down. Tube for the color ink has a shorter more direct path, and also mostly translucent with only a few blotches visible. The black ink tube looks dark. From here I can’t tell if the tube is dark because it is made of a different material, or if it’s dark because its innards are covered with black ink.

If its insides are covered with ink, that would imply a porous material in the print head rest position and these tubes deliver some amount of vacuum. Sucking ink into these tubes for whatever maintenance purpose it might serve. Do these tubes lead to a reservoir? Is there a limit to their ink sucking capacity? I shall seek answers to these questions later. Right now I will hold off disassembling this ink maintenance station. It might be more useful intact as reference while I explore whatever those tubes are connected to. And it would definitely be a huge mess to disconnect ink-filled tubes, so I’ll procrastinate on that and do something else instead.


This teardown ran far longer than I originally thought it would. Click here to rewind back to where this adventure started.

MX340 Print Head Maintenance Assembly Topside

I’m taking apart my old retired Canon MX340 multi-function inkjet and learning how it worked as I go. Its print head maintenance assembly is my current focus. Tracing through its range of motion, I finally have some answers for a question I had wondered about: why does it get so messy?

Given that inkjet printing required mechanisms that, well, jet out ink, it would be unrealistic to expect everything to stay clean and pristine. The print head needs a place to get primed and readied into a known operating state before it starts actually printing the page. A waste of expensive ink that I had grudgingly accepted as unavoidable. I had expected a sponge to absorb ink sitting below each print head, so I expected some ink splatter around maybe a 5mm perimeter around the print head outline. Once I opened the lid, I saw ink has been flung quite a bit further, up to ~40mm away.

After tracing through this assembly’s range of motion I now understand this mess was created by the wiper blades. Held up against the bottom of ink cartridges, they would have wiped off any ink from the surface of the print head. Once the cartridges moved past them, these elastic wiper blades would snap back to their vertical position. Surface tension would keep some ink on the blade, but the rest would launch for a landing elsewhere on this assembly.

There must be a slight angle between a cartridge and its wiper, as ink splatters are not symmetric: there’s visibly more ink flung towards the back of the printer (top of picture) than the front. The left-right asymmetry is more obvious and understandable, given the direction of the wiping motion. When these wiper blades snapped back vertical, that first motion would have moved left to right, with most of the energy on that first motion flinging ink to the right. Less (but not zero) ink would have been shed on the second motion to the left.

Curious about how much energy would have been involved, I took a cotton swab to poke at those wiper blades. (I didn’t want to get ink on my fingertips.) They have roughly the same flexibility as fresh automotive windshield wiper blades. I had expected them to have hardened up from age, more than a decade since their manufacture. Maybe they’ve hardened since new, but they’re still soft enough to do the job.

Since I already had soaked the tip of the cotton swab with ink, I poked at the rest of the ink-splattered components. All of the white plastic were rigid, no surprises there. There is a black rubber surround for each print head, and they are still very soft and pliable to form a good seal. Useful to keep ink from drying inside the print head.

The center, however, was a surprise. I had expected a soft spongy material to soak up ink, but the mystery material was actually quite rigid. Its surface texture implied some level of porosity like a sponge, but it had none of a sponge’s pliability. Very interesting! Maybe I can get more information about how it works by looking underneath.


This teardown ran far longer than I originally thought it would. Click here to rewind back to where this adventure started.

MX340 Print Head Maintenance Assembly Range of Motion

I’ve been playing with the print head carriage mechanism of a Canon Pixma MX340 multi-function inkjet, manually sliding it back and forth. I found no driveshafts conveying motor rotation, but I did find one lever it would push when at a specific position. The carriage also manipulates an ink-splattered assembly that I believe to be responsible for keeping the print heads in good working order.

The carriage pushes the maintenance assembly via its vertical tab on the far right, the only portion high enough to directly touch the carriage.

When the print carriage is absent, a spring pulls this assembly down and to the left. Here it is in the retracted position.

It can slide up and to the right at a ~45 degree angle for approximately 1cm. A small tab (circled in red) held back a section corresponding to the color ink cartridge so it is not raised as high as the rest of the assembly.

Beyond this point, the assembly only sides to the right with no further vertical movement. During this motion, the color ink cartridge subsection is allowed to rise up to join the rest. This right-most position, where the assembly is at its highest, corresponds to the print carriage parked standby position.

The two dark rectangles probably help keep the ink from drying out between print sessions. To the left of each of those two rectangles is a corresponding wiper blade. But if this assembly always moves in sync with the print head, there would be no wiping action.

Wiping is made possible by a spring-loaded latch. Here’s the maintenance assembly again in its highest right-most parked position as shown above, but at a different camera angle. The spring in the center of this picture pulls the assembly down and to the left.

As the print carriage moves left, the assembly is pulled left. It barely got past the 45-degree down-and-left transition before the latch (circled in red) blocked further movement. This blockage keeps this maintenance assembly in place while the print carriage continues moving left, and this difference in motion lets the wipers work.

The top of the latch reaches up towards the print carriage, high enough to be engaged by a tab on the carriage between the two ink cartridge slots. Ink cartridges were removed from this picture for a better view.

Once the wiping action is complete, the carriage moves further left and pushes the latch down.

This allows the maintenance assembly to slide the rest of the way down, retracting the two wipers away from their corresponding print heads.

Now that I have knowledge of how this assembly moves, I’ll take a closer look at its components.


This teardown ran far longer than I originally thought it would. Click here to rewind back to where this adventure started.

MX340 Print Carriage Motor And Actuation

I’m looking at the print carriage (“X-axis”) mechanism on my retired Canon Pixma MX340 multi-function inkjet, working to determine what that motor might do in addition to moving print cartridges (and their integrated print heads) back and forth across a sheet of paper. I’ve established it has linear encoder feedback for closed loop control over its entire range (32.5cm) of motion. I know the paper feed (“Y-axis”) motor does a lot more than just feed paper, what else might the print carriage motor do?

One pulley for the print carriage toothed belt is mounted directly to motor output shaft, with no gearbox or other mechanisms, so it’s not driving anything else on this end.

I had thought perhaps there would be a shaft for power transmission connected to the other belt pulley, but that search came up empty. The pulley is mounted on a sliding mount under spring tension so it could absorb mechanical shocks to the carriage system. There were no means to convey rotational power.

Looking for interactions beyond direct power transmission, I noticed a lever not far away.

It pokes through to the front, where it can be engaged by the print carriage.

Manually sliding the print carriage around, I found the lever is pushed by the print carriage when it is 2cm away from the right side edge. I won’t know what this lever does until further disassembly, but based on its position, I expect it is a way for the print carriage (X-axis) motor to shift something in the gearbox turned by the paper feed (Y-axis) motor.

And now that I’m thinking about it… there’s a chance the print carriage “parking brake” pawl does double duty. When the print carriage is in its rightmost parked position, the pawl can fully extend to keep the carriage in its parked position. When the carriage is slightly away from its parked position, the pawl hits the back of the carriage and could not fully extend. When the carriage is in the paper printing area, that pawl could fully extend again. When I take the gearbox apart, I’ll have to keep my eyes open to see if it does anything clever with a partially extended pawl.

But that’s not until later when I take apart that gearbox. More accessible right now is the print head ink maintenance assembly, which is also actuated by the print carriage.


This teardown ran far longer than I originally thought it would. Click here to rewind back to where this adventure started.

MX340 Print Carriage Range of Motion

Before I remove the print carriage motor assembly from my retired Canon Pixma MX340 multi-function inkjet, I thought it’d be a good idea to better understand its motion and how it interacts with the rest of the machine. I found a little “parking brake” for the print carriage, and that was a good start to help me dig deeper.

The print carriage moves two ink cartridges together. One for cyan/magenta/yellow color inks marked “C” and another for black ink marked “B”. Each cartridge has an integrated print head that is replaced whenever the cartridge is replaced. The carriage is attached to a loop of toothed belt, turned by a DC motor. Like the paper feed motor, there’s an optical encoder to provide feedback for closed-loop motor control. Except here it is a linear strip instead of a round disc, read by a sensor buried somewhere inside the carriage.

Here are some close-up pictures of the encoder strip and motor belt drive, showing details at either end.

On the left (as viewed from the front of the printer here) side, the encoder strip is held in tension by a small spring. The left side toothed belt pulley is directly mounted on the motor output shaft, a direct-drive system with no intervening gears.

On the right side, the encoder strip is held against spring tension with a small stamped sheet metal hook. The right side toothed belt pulley is held in tension with its own spring on the back side of the assembly.

The belt pulley tension spring is visible towards the lower left corner of this picture. During normal operation, I could see some horizontal motion (roughly 1-3 mm) in this spring assembly whenever the print carriage started moving, and it likely continues moving in less-visible ways afterwards as the print carriage changes direction or speed. In contrast, the encoder strip tension spring never moves, as expected for something serving as reference.

On either end of the encoder strip, a big circle is present beyond the line pattern. I initially thought this served as some kind of “end of the line” marker, an optical replacement for a physical homing switch. (Precedent: its scanner module uses an optical marker.) But I no longer think so due to two observations. The first is the 34cm width of the line pattern, wider than the print carriage’s maximum range of motion of 32.5cm which means the sensor inside the print carriage never has to move beyond the line pattern and would never see the big circles.

Without physical homing switch or special encoder strip markers, how would the system calibrate carriage position upon startup? Watching its startup sequence again, it appears the control board runs the carriage slowly in one direction until it bumps up against the end. Encoder feedback determines when it could move no further, at which point the process is repeated in the other direction. Proof of actual physical contact is visible as smears of grease left by the carriage on either end of its track.

After checking out the far left and far right limits of this mechanism, I started looking at what else it might do (beyond printing) in between those ends.


This teardown ran far longer than I originally thought it would. Click here to rewind back to where this adventure started.

MX340 Teardown Phase 3 Begins with Print Carriage

I’ve wrapped up my second pass exploring the paper feed motor of my retired Canon Pixma MX340 multi-function inkjet. Capturing data from its quadrature encoder reporting rotation motion had to be done while the system was still in a running state, and I think it’s the last useful data I could extract at my current skill level. Thus this marks the transition point between phase 2 and 3 of my original teardown plan. I will switch focus from electronic probing of phase 2 to mechanical disassembly like in phase 1. The main difference is while I still prefer to keep things in a running state for as long as I can, maintaining functionality is now less critical.

The most obvious target for starting phase 3 is the print carriage assembly, or “the X-axis” in my mind. Sitting on top of all remaining mechanical bits, it carries the two ink cartridges (“C” for colors cyan/magenta/yellow and “B” for black) with their integrated print heads across the printing area as well as a print head maintenance/parking area to the right. After seeing how the paper feed motor was linked to many other mechanisms in addition to feeding paper, I had expected to see similar clever multi-use of the X-axis motor and surprisingly didn’t find additional gears.

Speaking of that paper feed motor, I’ve taken my first step to unraveling its mysteries: it actuates a “parking brake” for the print carriage: A small white plastic pawl that extends (left picture) against the print carriage edge to keep it in its parked position, and retracts (right picture) to allow print carriage movement.

This pawl is connected to a shaft in the paper feed motor gearbox, but not rigidly. So when the pawl reaches one endpoint or another, the underlying shaft continues turning. This will loosen as the system wears, but (1) this geometry can tolerate a lot of wear and still do its job and (2) it has outlasted the service life of this machine so it was evidently good enough.

This pawl was retracted by the first 1800 encoder count rotation when the system powered up, and it was extended with the final 1800 encoder count rotation when the system goes into standby. There are many additional 1800 moves as the printer runs, so I doubt this parking pawl was the sole purpose of 1800 rotations. Certainly a useful related functionality, though.

Once carriage moves beyond its parked position, this pawl will no longer limit carriage movement. It will still move along with its loosely-attached shaft. If it should try to extend, though, it will hit either the flat back of the carriage or empty air depending on position within its full range of motion.


This teardown ran far longer than I originally thought it would. Click here to rewind back to where this adventure started.

Canon Pixma MX340 Paper Feed Motor Round 2 Summary

I’ve had my head in the world of quadrature encoder counts for so long I almost forgot to get data on how they corresponded to the real world. Now with “8640 encoder count per revolution” jotted down, I think it’s a good time to wrap up this chapter of exploration. I started with only the knowledge that this Canon Pixma MX340 multi-function inkjet would turn its paper feed motor even when not actually feeding paper. What is it doing? And while I have to wait for further disassembly for all the answers, I now know more about the control system than I did before.

Given presence of the quadrature encoder, this was a closed-loop control algorithm that adjusted power sent to its DC motor based on position reported by the encoder. Plotting encoder position vs. time reinforced my guess this is primarily a position-based system (“turn 1800 counts”) and less of a velocity-based system (“turn at 1800 counts per second”).

Though there is a velocity control aspect to the system. Plotting motor velocity vs. time added more information: unlike a hobby servo motor, this system doesn’t try to hit the target position at its maximum speed. Some motions are slower than others, but it’s not yet clear to me why some motions are faster than others.

Even though the system appears to be a position-based system with a high resolution encoder wheel, there is a small range of error tolerance. I saw frequent moves of 1800 encoder counts, but sometimes I saw only 1799 or 1798 that the system must have deemed close enough. It aligns with observed deceleration behavior where it seemed to deliberately err on the low side. Consistent with a desire to avoid the overshoot correction headaches of dealing with gear backlash.

Along with this understanding of system behavior, I also have a set of decoded quadrature reports in the companion GitHub repository. This chapter of exploration was interesting on its own, and it would be even better if the captured data becomes useful future reference, but that is yet to be determined.

This marks of my teardown phase 2, onward to phase 3.


This teardown ran far longer than I originally thought it would. Click here to rewind back to where this adventure started.

Captured CSV and Excel worksheets are included in the companion GitHub repository.

MX340 Line Feed Encoder Likely Delivers 8640 Counts Per Revolution

I’ve written down motions I decoded from a Canon Pixma MX340 multi-function inkjet as it went through various states, hoping that information will help me understand its mechanical internals when I take the print engine apart. However, that information was in terms of quadrature encoder counts. I also need to know what they are in terms of physical rotation.

Earlier, I took a close-up picture of the encoder wheel and its many very fine lines. Far too fine and far too many for me to contemplate counting them by eye.

When I had the quadrature encoders connected to my oscilloscope, I determined the sensor runs on 3.3V DC and it is only energized when the print engine is active. Trying to manually push some gears around would risk getting my fingers caught if it started running. But I can’t get any data during idle periods because the sensor receives no power when idle.

Solution: unplug the encoder from the system mainboard, and supply my own 3.3V DC to the sensor. An Arduino Nano has a convenient pin for supplying 3.3V DC.

I turned the gear train manually with my finger to turn the encoder wheel one full rotation, and saw the Arduino declare it had seen 8646 steps. This seemed like a very unlikely number, so I tried again and got 8652. A few experiments turning the gears back and forth determined my finger is far less precise than the encoder. Every time I move the gear and try to move it back to the exact same place, I would end up off by a margin of plus or minus 10 counts.

Given this error margin, I decided I’ll have to take a guess as to encoder wheel resolution. Since this is a rotation encoder, I decided it likely worked in terms of degrees. (Versus, say, radians.) Looking at the range of values I got, 8640 came up as a good candidate as it factors into 360 times 24. 24 encoder counts per degree seems like a useful number, easily dividing into halves, thirds, quarters, etc. as needed.

I can take this number and convert my earlier motion decoder output into degrees. For example, I saw many quick movements of 1800 encoder counts. At 24 encoder counts per degree, that means 1800/24 = 75 degrees. I’m not 100% confident of 8640 counts per revolution on this encoder, but if I’m wrong, 8640 should be close enough for my immediate needs. Good enough to wrap up this chapter of exploration.


This teardown ran far longer than I originally thought it would. Click here to rewind back to where this adventure started.

Captured CSV and Excel worksheets are included in the companion GitHub repository.

Motion Decoder Output Summary

I’ve created a small Arduino sketch that rapidly polls the quadrature rotation encoder of a Canon Pixma MX340 multi-function inkjet and parse that long stream of data into a concise list of movements. I hoped it would help me break down what the print engine is doing. At the moment I won’t be able to translate this data into actual printing functionality, that would come after I correlate these motions to what I’ll discover upon further mechanical teardown.

timestamp,count,min_us_enc
16,1799,28
3785088,2701,36
4262908,-1800,-29
4407660,-1799,-28
7253384,28019,36
11663472,2699,36
11917992,-2699,-38
12176620,-15000,-68
13994420,1800,28
16146804,-1799,-28
16290108,1799,28
16441336,-1799,-28

My tool recognized 12 movements in the system power-up sequence.

  • 7 of them are movements of 1800 encoder positions, at a fast speed of ~28 us/enc. 3 in the positive direction, 4 in the negative direction. (In this system, negative is the direction of paper feed during actual printing.) Some of them are closely paired: negative immediately following positive, but some are interspersed with other motions.
  • 3 of them are movements of 2700 encoder positions, at a slower speed of ~36 us/enc. 2 in the positive and 1 in the negative direction. The second positive 2700 move is immediately followed by the -2700 move.
  • 1 long movement of 28020, at a speed of ~36 us/enc similar to the 2700 movements.
  • 1 long movement of -15000 at a slower speed of ~68 us/sec.

Looking at the system stand-by sequence, I see much of the same components in the list of 15 movements. (It’s not pasted here but available on the companion GitHub repository.)

  • 9 x 1800 @ 28, 5 positive and 4 negative.
  • 2 x 2700 @ 36, 1 positive and 1 negative.
  • 1 x 28020 @ 36
  • 1 x -15000 @ 68

But there were two unique to the stand-by sequence:

  • 1 x 251200 @ 28, a very long roll.
  • 1 x -25120 @ 28 that immediately followed.

I had expected the standby sequence to have unique movements related to putting away the ink cartridges, so these two are good candidates. Other than that, I was surprised to see it repeated much of the same movements as the power-up sequence. I had expected to see something unique during power-up related to getting the ink cartridges ready, but apparently not. Perhaps “get ink cartridge ready” doesn’t occur until the actual printing sequence, which is much more complicated.

  • -49720 @ 24
  • -1310 @ 160
  • Rocking back and forth with 4 x 1800 @ 28.
  • -22421 @ 19. Both the gear and paper sensors changed state during this movement. Did the 4×1800 engage a mechanical clutch or something? I have to look for that.
  • 3000 @ 20
  • -12300 @ 20. (The gear sensor changed state again somewhere in here.)
  • 6200 @ 36
  • -1200 @ 28

Then a long list of 82 x -961 @ 38 movements, each corresponding to the print head putting down a line of ink. Around the 72th iteration, the paper sensor changed state as the bottom edge of the sheet fed beyond the paper tray where the sensor lived. After the 82nd single-line movement, there was another sequence to eject the printed sheet.

  • -3475 @ 20
  • -12905 @ 14
  • -3282 @ 38

Very interesting there were three separate movements in the paper feed direction, at three different speeds.

  • 2700 @ 36, our old friend returns.
  • -1600 @ 29

That’s a lot of movements unique to printing a page. I’m not sure I could link them all to specific mechanical functionality, but at least I’ll have this data on hand as reference when taking this gearbox apart. Better to have it and not know what it means, than to not have it and wishing I did later when the gearbox is in pieces. But right now, I want to map these encoder counts to physical movement.


This teardown ran far longer than I originally thought it would. Click here to rewind back to where this adventure started.

Captured CSV and Excel worksheets are included in the companion GitHub repository.

Initial Motion Decoder Outputs Look Good

I’m trying to keep an Arduino project’s code simple, which required resigning myself to the fact it won’t be very robust as it decoded paper feed motor motion of a Canon Pixma MX340 multi-function inkjet. I’m at the mercy of a magic threshold value, and the errors it could introduce if it’s too small or too large.

The Arduino sketch is looking at position reported by a quadrature encoder in this gearbox and, if it hasn’t moved in 10 milliseconds (my magic threshold value), print how far it has moved since the last time it stopped someplace for at least 10ms. I’ve also added code to track the shortest time between encoder positions encountered during this interval, which reflects the fastest speed attained.

Before this threshold-triggered report, I would have a long list of numbers that I could import and plot in Excel. Here’s the position & velocity graph for the machine’s startup sequence.

And now, I have a very short list of movements taken and how fast it moved to get there. Here is the startup sequence again in the new format:

timestamp,count,min_us_enc
16,1799,28
13003168,2701,36
13478700,-1800,-28
13622500,-1800,-28
16468560,28020,36
20880704,2700,36
21135412,-2700,-38
21392592,-15000,-68
23213924,1800,28
25595052,-1799,-28
25739804,1798,28
25884356,-1798,-28

Timestamps don’t line up between these two different presentations because they were taken on different sampling runs, but the change in encoder counts and velocity match. This is a far more concise report of motion control behavior, presenting information I wanted and discarding the rest.

One big difference between this output and the goals I had originally set is the lack of reporting on times when the system sat still. I thought it would be useful to know when nothing changed from time X to time Y, but the simple implementation generated noise from small movements and I didn’t come up with an elegant way for it to coexist with my debounce code. I thought about it some more and remembered my goal here is to capture what kind of movements are involved in this gearbox. I don’t really care about the times when it didn’t move, so I deleted all associated code as unnecessary complexity.

We’ll see if that turns out to be the right call or if I will regret not investing the effort to make it work. For now, this decision means a caveat on interpreting my decoded output: timestamps corresponding to each motion includes the time spent sitting still before each motion. Example: the third and forth lines of data both reflect a move of -1800 encoder counts…

13478700,-1800,-28
13622500,-1800,-28

The timestamps are only about 144 milliseconds apart, but looking on the big chart above we can see the actual movements are nearly 3 seconds apart. That’s because the second timestamp here was actually the start of that ~3 second period of staying still, before moving another -1800 encoder counts.

Despite its flaws, I think it’ll be useful enough of a tool to parse the motions I’ve been looking at.


This teardown ran far longer than I originally thought it would. Click here to rewind back to where this adventure started.

Captured CSV and Excel worksheets are included in the companion GitHub repository.

Trying Dwell Time To Delineate One Motion From Another

After fumbling around the edges for a while, I finally got a decent acceleration/deceleration plot of paper feed motor in a Canon Pixma MX340 multi-function inkjet. It was very informative not only in a “satisfy curiosity” way, but also in a “oh, my plan isn’t going to work” way as well. Better I discover the flaw now rather than later!

The challenge is to recognize when one motion has ended and another has begun. My first effort was to sample encoder position as fast as possible and, when there’s zero delta between two samples, declare that a point of delineation. This idea failed spectacularly. So I thought I could base my decision on acceleration: when the motor starts accelerating after a period of deceleration, declare that a point of delineation. But now that I’ve looked at the actual plot, I know that won’t work either. Several changes in acceleration rates occur within a single motion during normal operation, so that is not a reliable indicator to use.

I could withhold decision until acceleration exceeds a certain threshold, but that means I have to track a longer history. Back to when the candidate delineation point existed, so I could output that data when the decision is made. I’d like to avoid adding such runtime data management complexity. On top of that, it would add a threshold setting problem into the mix.

If a threshold setting problem is inevitable, I might as well try it in the context of something simpler with less data to manage: dwell time. Defined as: how much time the system spends sitting at a particular encoder position. This is similar to the earlier “zero delta between two samples” approach, but now based on microsecond timestamp rather than an unpredictable “time elapsed between polls by loop().” Looking over the data I captured of system startup, I see “not quite there yet, need a little kick” dwell times of a little over 9000 microseconds. Given that, I’ll start with a dwell time of 10000 microseconds (10 milliseconds).

I think it’s better to have this threshold a little too low versus too high. When it is too low, it would falsely break up a single motion. For example, “Moved 1798” then “moved 2” instead of desired “moved 1800”. This will add noise to the motion decode output, but I think it is the lesser evil. Setting it too high would falsely combine multiple motions into one: “Moved 900” instead of “Moved 2700” and “Moved -1800” and such mistakes would be more difficult for me to recognize when looking at motion decode output.


This teardown ran far longer than I originally thought it would. Click here to rewind back to where this adventure started.

Captured CSV and Excel worksheets are included in the companion GitHub repository.

MX340 Paper Feed Motor Acceleration/Deceleration

I’m working to interpret quadrature decoder positions reported for the paper feed motor of a Canon Pixma MX340 multi-function inkjet. I was happy a relatively simple debounce filter cleaned up a lot of the noise introduced by small encoder movements, but I was still having a hard time interpreting the results. I knew this would be a problem when I chose to log “microseconds per encoder count”. It was the reciprocal of the more obvious “encoder count per microsecond” velocity. I chose it to keep computation in the integer realm, avoiding floating point math. It should help keep the ATmega328 microcontroller in my Arduino Nano fast and responsive, with the tradeoff of causing me headaches now in analysis.

After squinting at this for a while, I realized I was being silly. I’m looking at the data after the fact, I no longer have to concern myself with keeping code fast and responsive. Furthermore, I’m now on a desktop computer whose CPU had floating point capabilities the ATmega328 lacked. I added a new column in Excel, with the simple formula of 1 divided by us/enc, and graphed resulting enc/us as my orange line.

Beautiful! Now the graph is a lot easier for me to grasp at an intuitive level. It’s easy to see motions for this startup sequence occur at several different peak velocities, and it even showed an artifact I wanted to investigate further: little velocity spikes book-ended some of these movements. (Might not be visible at blog resolution here. There’s a zoomed-in version below.)

When skimming through the raw us/enc data, I noticed the change in velocity was not uniform.

[...]
2963072,4484,1,992
2964064,4485,1,980
2965044,4486,28,1448
2966492,4487,27,1428

2967920,4488,1,1052
2968972,4489,1,1076
2970048,4490,1,1024
2971072,4491,1,1024
2972096,4492,14,1248
2973344,4493,130,3148
2976492,4494,324,6376
2982868,4495,88,2564
2985432,4496,18,1408
2986840,4497,5,1132
2987972,4498,3,1108
2989080,4499,1,1016
2990096,4500,952,[...]

This excerpt was from second movement decelerating towards its final position of 4500. From a peak speed where only about 65 microseconds were spent at each encoder position, this excerpt started when we’re slowed enough to spend almost 1000 microseconds (1 millisecond) at each position. Position 4486-4487 each got around 1400us, then the system sped up. Then it slowed down towards position 4494. Over 6 milliseconds were spent there, then we see a final kick to bring it to position 4500.

Zooming in to the velocity plot of first three movements, I can see this “not quite there… little more power… not quite there… more power” as a bit of saw tooth shape at the end of each deceleration curve. This graph also showed me something I hadn’t noticed earlier: a similar saw tooth at the beginning of the second and third movements. They started moving with a sharp acceleration that was then dialed back before reaching their target velocity.

What might this mean? I speculate movements started with extra power in order to overcome static friction in the system. Once things started turning, the closed-loop motor control algorithm reevaluated power levels to maintain target acceleration on its way to target velocity. Then for deceleration, the control algorithm might deliberately aim for a slight undershoot, adding little bursts of power towards the end to reach target position. Aiming for a slight undershoot makes sense to me. If it had overshot, correction would have had to deal with gear backlash and reversing the inertia of the entire system, a much bigger can of worms.

Whatever the reason, the fact is acceleration/deceleration rates varied within a single movement, something easily visible once I actually plotted velocity vs. position. It’s a pretty cool discovery even though it invalidated a plan I had.


This teardown ran far longer than I originally thought it would. Click here to rewind back to where this adventure started.

Captured CSV and Excel worksheets are included in the companion GitHub repository.

Simple Debounce Improved Motion Decoding

My current Arduino project is to translate a quadrature encoder’s positions over time into a series of movements, in the hope it would help me understand the inner workings of a Canon Pixma MX340 multi-function inkjet. Trying to keep the project simple, it was simpler to calculate “microseconds per encoder count” (shortened to us/enc below), which is the reciprocal of velocity “encoder count per unit of time”. I think it’ll still have all the information I need. I graphed output from my first draft sketch and it looked like a promising start.

The first problem I want to tackle is noise introduced by the encoder bouncing back and forth between two adjacent values. For example, 1799 then 1800 then back to 1799. This happens because the motion control system could not (or deliberately chose not to) hold the motor at a precise location, allowing it to move around a bit. Since these small bounces aren’t very frequent, they work out to very large us/enc values. Without any processing, the raw plot results in lots of noise in the orange line that doesn’t correspond to any actual movement on the blue line.

To keep my code simple, I’ve been resisting solutions that require me to implement a long history buffer, wary of bugs as I traverse the buffer. I’ve been able to get away with tracking a single history point so far, but in order to recognize bounces, I need to track a second history point to know if I’m just bouncing back and forth between the two history records. As expected, maintaining double the history entries approximately doubled my code complexity, but at least it’s still simpler than implementing a circular buffer or anything along those lines.

The results were worth it! A bit of debounce code eliminated all obvious noises, leaving me with a much cleaner output so I can get a better understanding of this system’s behavior.


This teardown ran far longer than I originally thought it would. Click here to rewind back to where this adventure started.

Captured CSV and Excel worksheets are included in the companion GitHub repository.

Graphing Position Alongside Microseconds Per Encoder Count

I’m on a side quest decoding motion reported by the quadrature encoder attached to the paper feed motor of a Canon Pixma MX340 multi-function inkjet. Recording encoder counts was easy and gave me some preliminary insights into the system, but now I want to make my data probe smarter and parse those encoder positions into movements. This has proven more challenging. In an effort to keep the project relatively simple, I’m trying “microseconds per encoder count” as a metric that should be easy to calculate with integer math. This is the reciprocal of the more straightforward “encoder count per microsecond” velocity measurement and I hope I can get all the same insights.

I expect “microseconds per encoder count” (shortened to us/enc for the rest of this post) would be low when the motor is spinning rapidly, and high when it is spinning slowly. Above a certain threshold, the system is spinning slowly enough to be treated as effectively stopped.

Based on this expectation, I should be able to divide up recorded positions into a list of movements. The start and end of each movement should be a spike in us/enc that would be high but below “effectively stopped” threshold. These spikes should correspond to acceleration & deceleration on either end of a movement. I revisited the system startup sequence with a rough draft and Excel generated this graph. The blue line is the familiar position graph of encoder counts, and orange line is my new us/enc value.

The best news is that us/enc worked really well for my biggest worry between 15 and 16 seconds, on either side of blue line peak. The motor decelerated then accelerated again in the same direction, something I couldn’t pick up before. Now I see nice sharp orange spike marking each of those transitions on either side of the spike corresponding to direction reversal.

The most worrisome news is that, right after the 13 second mark when the system started its long roll towards the peak, there was barely a spike when its acceleration should have shown up as a more significant signal. I have to figure out what happened there. It may reflect a fatal flaw with this us/enc approach.

Less worrisome but also problematic are the extraneous noisy spikes on the orange us/enc line that had no corresponding movement on the blue position line. Majority of which occurred between 8 and ~10.75 seconds. During this time, the print carriage is moving across its entire range of motion (likely a homing sequence) and that vibration caused a few encoder ticks of motion in the paper feed roller mechanism. I think such small movements can be filtered out pretty easily.


This teardown ran far longer than I originally thought it would. Click here to rewind back to where this adventure started.

Captured CSV and Excel worksheets are included in the companion GitHub repository.

Motion Decoder Trying Microseconds Per Count

I know the paper feed motor in a Canon Pixma MX340 multi-function inkjet does more than just feed paper, and I want to see how much I can understand. One small step at a time. Right now I have an Arduino Nano watching its rotation quadrature encoder. I want some level of precision, but I don’t want to spend time learning an entirely new field.

So I’ll stay with Arduino’s micros() API to give me a timestamp a few hundred microseconds after the most recent encoder position update. The variability will add error to my calculations, but I’m hopeful the errors will average out across multiple data points. If not, I’ll have to revisit the topic of timestamp precision.

timestamp,position,count
16,0,448737
6489548,1,1
6490076,2,1
6490688,5,1
6491300,8,1
6491912,12,1
6492540,17,1
6493220,21,1
6493876,25,1

[...]

The next most obvious step is to calculate velocity between each of these data points. For the final two line in the excerpt above, the distance is 25-21=4 encoder counts. That took place within 6493876-6493220 = 656 microseconds. 4/656 = 0.006 encoder counts per microsecond. Easy enough on paper, but a big problem in practice. The ATmega328P chip at the heart of this Arduino Nano has no floating point math hardware, so such a calculation would have to run through a math library that will add a lot of computation time to this very time-constrained project.

My first thought was maybe I can aggregate calculation across multiple data points, but that means tracking multiple data points. So far I’ve been trying to limit it to just two: the “now” data point and the “previous” data point. It makes for simple code with few things to go wrong, so I’m trying to avoid multiple data points for as long as I can get away with it.

Since I’m reluctant to pull in floating math or multiple data points, I thought I would try a different approach. If my problem is that “encoder counts per microsecond” is a small floating point number, perhaps its reciprocal “microseconds per encoder count” could help me? It would be a much easier calculation: Instead of 4/656 = 0.006 encoder counts per microsecond, I can look at it as 656/4 = 164 microseconds per encoder count. Staying in integer math should keep the code fast, and staying with two data points (‘now’ and a single history point) make the code simple. I ran the simple code and plotted its output… it looks promising, but there’s definitely still work to do.


This teardown ran far longer than I originally thought it would. Click here to rewind back to where this adventure started.

Captured CSV and Excel worksheets are included in the companion GitHub repository.

Options for Improving Timestamp Precision

After a quick test determined that my Arduino sketch will be dealing data changing at a faster rate than 1kHz, I switched the timestamp query from calling millis() to micros(). As per Arduino documentation, this change improved time resolution by 250 from 1 millisecond precision to 4 microsecond precision. Since I had time on my mind anyway, I took a research detour to learn how this might be improved further. After learning how much work it’d take, I weighed it against my project and decided… nah, never mind.

Hardware: ATmega328P

A web search for ATmega328P processor programming found good information on this page Developing in C for the ATmega328: Marking Time and Measuring Time. The highest possible timing resolution is a counter that increments upon every clock cycle of the processor. For an ATmega328P running at 16MHz, that’s a resolution of 62.5 nanoseconds from ticks(). This 16-bit counter overflows very quickly (once every 4.096 milliseconds) so there’s another 16 bit counter ticks_ro() that increments whenever ticks() overflows. Together they become a 32-bit counter that would overflow every 4.47 minutes, after that we’re on our own to track overflows.

However, ticks() and ticks_ro() are very specific to AVR microcontrollers and not (easily) accessible from Arduino code because that kills its portability. Other microcontrollers have similar concepts but they would not be called the same thing. (Example: ESP32 has cpu_hal_get_cycle_count())

Software: Encoder Library

Another factor in timing precision is the fact that I’m not getting the micros() value when the encoder position is updated. The encoder position counter is updated within the quadrature decoding library, and I call micros() sometime afterwards.

timestamp,position,count
16,0,448737
6489548,1,1
6490076,2,1
6490688,5,1
6491300,8,1
6491912,12,1
6492540,17,1
6493220,21,1
6493876,25,1

Looking at the final two lines of this excerpt, I see my code recorded encoder update from position 21 to 25 over a period of 6493876-6493220 = 656 microseconds. But 6493876 is only when my code ran, that’s not when the encoder clicked over from 24 to 25! There’s been a delay on the order of three-digit microseconds, an approximation derived from 656/(25-21) = 164.

One potential way to improve upon this is to add a variable to the Encoder library, tracking the micros() timestamp of the most recent position update. I can then query that timestamp from my code later, instead of calling micros() myself which pads an unknown delay. I found the encoder library source code at https://github.com/PaulStoffregen/Encoder. I found an update() function and saw a switch() statement that looked at pin states and updated counter as needed. I can add my micros() update in the cases that updated position. Easy, or so I thought.

Looking at the code more closely, I realized the function I found is actually in a comment. It was labeled the “Simple, easy-to-read “documentation” version 🙂” implying the actual code was not as simple or easy to read. I was properly warned as I scrolled down further and found… AVR assembly code. Dang! That’s hard core.

On the upside, AVR assembly code means it can access the hardware registers behind ticks() and ticks_ro() for the ultimate in timer resolution. On the downside, I don’t know AVR assembly and, after some thought, I decided I’m not motivated enough to learn it for this particular project.

This was a fun side detour and I learned things I hadn’t known before, but I don’t think the cost/benefit ratio makes sense for my Canon MX340 teardown project. I want to try some other easy things before I contemplate the harder stuff.


This teardown ran far longer than I originally thought it would. Click here to rewind back to where this adventure started.

Captured CSV and Excel worksheets are included in the companion GitHub repository.

Motion Decoder Timestamp Switching to Microseconds

I want to decode motion reported by the rotation quadrature encoder inside a Canon Pixma MX340 multi-function inkjet. My first attempt comparing encoder count differences proved to be a failure, so I will have to incorporate those lessons before trying again.

The first lesson is that making decisions on changes between two iterations of a loop makes the code dependent on microcontroller execution speed. This is an unreliable metric because behavior would change if I compile it to run on different hardware. And even if the hardware is unchanged, doing different things within an iteration (like printing data out to serial port) would consume more or less time than than a different iteration. For some projects, such variability doesn’t matter much, but it has proven to matter greatly here.

To solve the loop iteration-to-iteration variability problem, I need to switch to a system where calculations are based on a measure of time. Arduino uses millis() for time stamps in many examples, so I’ll start with milliseconds as my time stamp against encoder readings. And for reference, I’ll also count how many loop iterations were spent at each encoder position. My earlier failure told me this number is occasionally greater than one even when the system is moving, I wanted to know more.

Here’s the output for machine startup:

timestamp,position,count
0,0,878490
10604,2,95584
11758,4,1871
11782,6,341550
15905,7,1
15906,8,1
15906,10,1
15907,13,1
15907,15,1
15908,19,1
15908,23,1

[...]

As expected, a lot of time was spent near position zero as the machine powered up. But as soon as the paper feed motor started turning in earnest, encoder position count started changing more dramatically changing once per encoder poll iteration. Critically, both were changing faster than the millisecond time stamp counter. Position 8 and 10 were both stamped with 15906. Position changed from 13 to 15 within the same millisecond, etc.

Now I know the Arduino sketch is running fast enough to keep up at some speed faster than 1 kHz, which I wasn’t sure about before. This is actually excellent news. The timestamp issue is thankfully easy to resolve, because Arduino framework also provides micros() so it was easy to switch to microseconds for my time stamps.

timestamp,position,count
16,0,448737
6489548,1,1
6490076,2,1
6490688,5,1
6491300,8,1
6491912,12,1
6492540,17,1
6493220,21,1
6493876,25,1

[...]

That looks much better. It’s not literally 1000 times better because, as Arduino documentation stated, micros() doesn’t always deliver microsecond resolution. For ATmega328-based Arduino boards like the Nano I’m using, the resolution is limited to four microseconds when running at 16MHz. And looking at my output, the timestamps are indeed all multiples of 4. Still a huge improvement but it made me wonder: can I do even better?


This teardown ran far longer than I originally thought it would. Click here to rewind back to where this adventure started.

Captured CSV and Excel worksheets are included in the companion GitHub repository.

Motion Decoder Fail: Zero Delta Between Two Samples

I have wired up an Arduino Nano to a retired Canon Pixma MX340 multi-function inkjet, reading the position reported by a rotary motion quadrature encoder in its paper feed motor gearbox assembly. I want to learn how that mechanism worked, and thought it would be helpful to process raw encoder data into a list of movements undertaken by the mechanism.

Looking at the graph I plotted earlier, this looked pretty straightforward. I added code in my Arduino sketch to poll encoder value in a tight loop and, when two consecutive readings have zero delta between them, treat that as a stopped segment between two movements.

This approach did not work at all! But its failure taught me more about this system’s behavior.

First lesson: as the print carriage moved around, it jostles the whole frame enough for this paper feed encoder to bounce one or two counts off target. I don’t know if it’s impossible/impractical to move this motor system by a single encoder position, or if the control system just decided it wasn’t important enough to bother. Either way, there are small drifts that were too small for me to see in my earlier graphs but would falsely break up zero-delta periods.

A closely related observation: the motor decelerates as it approached its target position, and it doesn’t always hit its target precisely by the time it coasted to a stop. (This is assuming a move of 1798 counts was intended to be a 1800 count move.)

Speaking of that coast phase, the graph shows it can take 20-30 milliseconds before everything comes to a stop. This is a problem, because the Arduino is polling encoder fast enough that it will see the same value multiple on consecutive polls. So if I’m deciding based on zero delta between two readings, it would prematurely conclude the gear train has stopped when it was merely at the very beginning of acceleration or the slow tail end of deceleration.

After one deceleration, the system might immediately start accelerating to execute another motion. One example is visible as the second and third movement in the graph above. From Arduino Nano’s perspective, the delta between two consecutive readings never reached zero between those two movements. Maybe the printer control board decided “slow enough” and started the next move before things actually stopped, or maybe the Arduino is not polling fast enough to catch that brief moment of zero rotation.

I had a laugh at how my system managed to poll encoder value at a rate that is simultaneously too fast and too slow. But the conclusion from these new observations is clear: I can’t get away with just two encoder samples and look for a zero delta between them, my code will have to base its decisions on more reliable factors.


This teardown ran far longer than I originally thought it would. Click here to rewind back to where this adventure started.

Captured CSV and Excel worksheets are included in the companion GitHub repository.

Canon Pixma MX340 Decoder Round 2 Goals

I want to understand how the paper feed mechanism works in a Canon Pixma MX340 multi-function inkjet, starting with positions reported by its rotational quadrature encoder. Round 1 looked at raw position data polled every 10ms. This approach quickly ran into limitations, but it informed what I want to accomplish for round 2.

Seeing several moves of 1800 encoder count increments hinted this system acts as a position-based system (“Go to position X”) like a servo motor. This doesn’t necessarily exclude the possibility of occasionally acting as a velocity based system (“turn at this speed”) but I can start by focusing on the positioning aspect.

All of my observations show an acceleration to a target speed, and kept spinning at that speed until it was time to decelerate to stop at a target position. If there are any velocity-based operating modes, I haven’t seen any sign the velocity changes in response to any system behavior. I observed several different target speeds for different moves, but the speed seems to stay constant within a single move.

Given these observations, my goal for round 2 is to process encoder position to generate a list of timestamped relative positioning. A secondary goal is to also include peak velocity. I can calculate average velocity from timestamp and position. I expect average will be somewhat lower than peak due to the accelerate/decelerate stages. If there is significant deviation, I know either something went wrong in my code, or the rotational velocity varied during the move.

Here’s an example to illustrate my goal:

An excerpt from the power-up sequence, this was the first three movements. It was preceded by a long series of zeros before anything moved. Then there was a move of ~1800 counts over ~140 milliseconds. Then a short period of no motion. Then another move of ~2700 counts over ~240 milliseconds, immediately followed by a reversal of -1800 counts over 140 milliseconds before another period of stillness.

Round 1 gave me a long list of positions every 10 milliseconds. I want round 2 to give me something like:

millis,change,v-max-10ms
5151,0,0
140,1798,237
230,0,0
240,2700,148
140,-1800,-239
100,0,0

These numbers were not precisely calculated, merely to show the desired format. I want a much more concise description of motion than the position-every-10ms raw dump of round 1. This means putting more data processing logic in the Arduino. I tried the easy thing first and it did not go well, but I learned a lot from the failure.


This teardown ran far longer than I originally thought it would. Click here to rewind back to where this adventure started.

Captured CSV and Excel worksheets are included in the companion GitHub repository.

Quadrature Decode MX340 Print

I’m fascinated by the print engine inside a Canon Pixma MX340 multi-function inkjet, there’s a lot I don’t understand but at least it felt like some level of understanding is attainable. Processing a lot of periodic encoder value reports, I saw its standby sequence was longer but not terribly more complex than the power-up sequence. But that’s not the main business of an inkjet print engine. Its business is printing!

Here’s a trace from printing a page, a process that took just under two minutes. (~110 seconds.) And wow, I see a lot of activity. The long shallow slope in the latter half of this graph is where actual printing was in progress, though the shallow slope line visible here is misleading.

Zooming in to that section, the actual motion is visible as a periodic advancement of a bit less than 1000 encoder counts, then held steady as the print carriage moved across to lay down ink. Then it advances another <1000 counts, and so on. This section appeared to be a single long shallow slope only because I had packed too many data points into a single graph and important detail has been lost. I zoomed into the graph at various locations and didn’t discover other artifacts, but I am still wary of drawing too many conclusions from visual inspection of this graph.

Despite that caveat, it’s pretty clear that preparatory work took more time than the actual printing process with ink on paper. This chart also tells me the photo interrupter sensor sampling wires are functioning correctly. Since paper is actually fed, this chart showed activity on the paper presence sensor (blue line) and the gearbox sensor of yet-unknown purpose (orange).

I think I’ve reached limits of the “dump periodic data to Excel, look at graph” analysis method. It was an interesting and easy way to make my first pass on analyzing this data, and it informs my goals for the next pass.


This teardown ran far longer than I originally thought it would. Click here to rewind back to where this adventure started.

Captured CSV and Excel worksheets are included in the companion GitHub repository.