Probing MP1584 Enable Pin

I want to use a MP1584 buck converter module for a solar-powered project, and to explore its behavior I used a bench power supply to vary volage input from zero volts up to expected operating voltage. I heard an audible screech from the circuit within the 3-5 volt range and decided not to go further until I better understood what’s going on.

The first step to problem solving is always to Read The Fine Manual, in this case MP1584 data sheet published by Monolithic Power Systems. The first surprise was the big read “NOT RECOMMENDED FOR NEW DESIGNS REFER TO MP2338” stamped across every page. I guess this chip is getting phased out by Monolithic, and at some point I will have to learn about a different chip. But that doesn’t matter today so I proceeded to read about its startup behavior. Specifically the EN (Enable) pin on this chip. According to this document, MP1584 will start up when EN is above 1.5V.

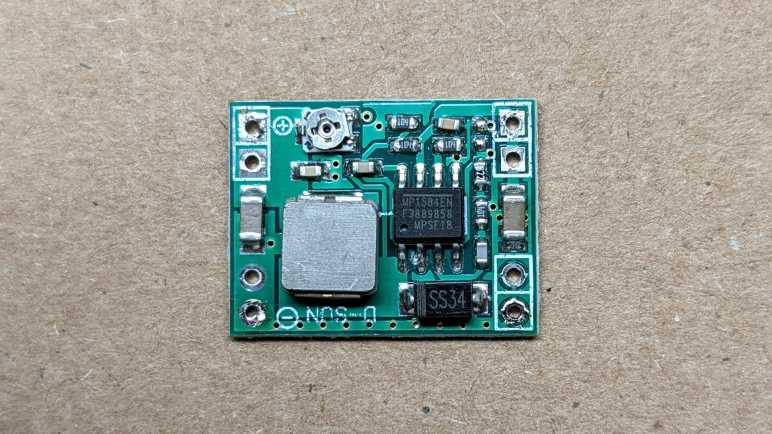
Great, what does that mean for my little board, purchased from Amazon from the lowest bidder that day? I laid the board flat and started probing. From what I can tell, the EN pin is connected to a straightforward voltage divider ladder, using two resistors of equal value. These little surface mount resistors have “104” printed on them, indicating they are 100kΩ plus or minus some percentage of tolerance.

Here is the same image in light grayscale, and I filled some color into the relevant areas.

EN trace is in blue, and its circuit board trace immediately goes under the chip to emerge to the left moving up. Running between the two poles of a capacitor(?) it reaches the two voltage dividing resistors. The top resistor bridges between EN and ground, which I filled in black. The lower resistor bridges between EN and voltage input, which I filled in red. Vin can be seen connecting to the Vin solder pads to the upper right.

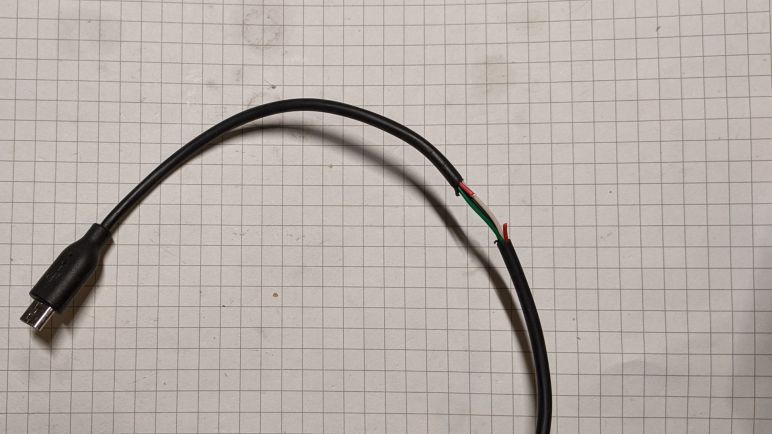
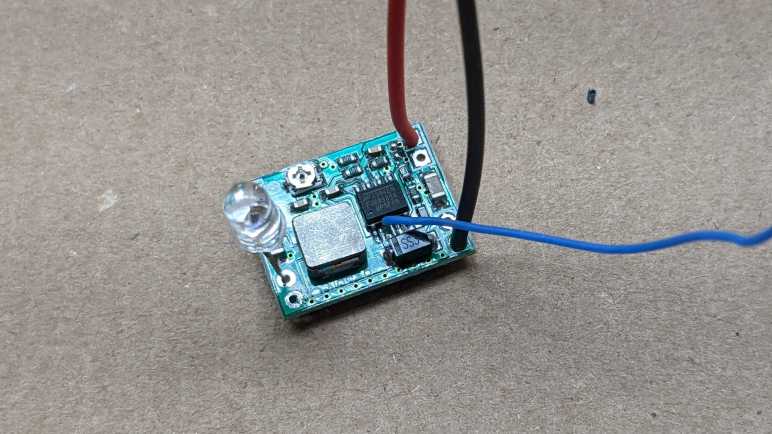
A voltage divider with two equal value resistors means voltage of EN will be half of input voltage. To test this hypothesis, I soldered a wire to this pin so I could measure its voltage as I vary the input voltage. A small 5mm LED module was connected to MP1584 output. This is a self-cycling unit that quickly flashes through different colors from RGB mixes.(*) I used it here because it tolerates a slightly wider range of input voltage and current than just a single diode, plus it is inexpensive and disposable in case something went wrong with this experiment.

Clipping a voltage meter to the blue wire, I quickly confirmed the hypothesis is correct. EN voltage is approximately half of input. Therefore, if a MP1584 activates at 1.5V, this circuit will activate with 3V input. This is a problem when the potentiometer has been adjusted for 3.3V output. This is a buck converter. It lowers voltage and could not raise it! No wonder it was unhappy and screeched its displeasure.

But now that I have a basic understanding of how this module decides to come alive, I could modify it to suit the project at hand.

Investigating MP1584 For Solar Power

I am happy with the performance I’ve seen so far of an INA219 DC voltage/current sensor, and it is one step closer to the goal of a homebuilt power output monitor for my Harbor Freight solar array. All the major pieces are now in place: I have a working INA219, driven by an ESP8266, running code generated by ESPHome, with resulting data collected by Home Assistant.

The next challenge I wanted to tackle was to make this system run exclusively on solar power without a battery. The daytime scenario is easy: solar panel power can feed into MP1584 buck converter to power the circuit. The night scenario is also easy: there’s no power and nothing happens. The hard part comes during the transition between those scenarios: gracefully power up around sunrise, and gracefully shut down around sunset. I don’t expect this exploration to be easy as it will have to deal with all the vague parts of the real analog world. Very different from the digital thinking my brain is familiar with.

But before I go into the real world, I can explore a crude simulation on my workbench. I connected the input wires to my bench power supply to see how the system behaves. From zero to three volts nothing appears to happen, which was expected. From approximately five volts and up, the system is up and running. But between three and five volts, I hear a disconcerting screech from the buck converter module, and the ESP8266 seems to startup erratically. There is a blue LED that is expected to illuminate once, for a fraction of a second, during ESP8266 power-up. But when I hear the screech, I also see the LED blink seemingly randomly. Implying that ESP8266 would try to start up but fail, then try again, and repeat.

It looks like I need to better understand the expected behavior for a MP1584 during this borderline scenario, and see how it aligns with my observations.

A Tale of Two ADCs: ESP32 versus INA219

I started looking at Home Assistant and ESPHome because I realized I did not have enough enthusiasm to write my own sensor data gathering and processing framework. Learning how to put an ESPHome node to sleep to save power was one of many steps I had to retrace, but I’m finally ready to pick up where I left off with an INA219 DC voltage and current sensor breakout board.

I had been using an ESP32 with its integrated ADC to monitor the DC voltage output of my MPS500 battery. I started with an ESP32 because they received factory calibration by Espressif whereas the ESP8266 did not. Sadly that wasn’t as useful as I had hoped because the ADC was only capable of measuring up to 2.45 volts. The MPS500 battery voltage range is consistent with three lithium chemistry battery cells in series (“3S”) meaning up to 12.6V, requiring a voltage divider built with a few resistors. These were cheap resistors that were several percent off the nominal value, so I had to use my voltage meter to recalibrate anyway.

While off-nominal resistors would affect the accuracy of my readings, I had expected the precision to be pretty good if I followed Espressif recommendation on reducing ADC noise with use of multisampling plus a bypass capacitor. And indeed the results were perfectly sufficient for me to log the change in battery voltage over time.

But once I had an INA219 up and running, it took over voltage monitoring duty in addition to current (and power) monitoring. After just one day, I can see the task-specific ADC circuit in an INA219 significantly outperformed the general-purpose ESP32 ADC. This graph covers two days: the day before switchover, and the day after.

The green line on the left were voltage fluctuations recorded by ESP32 ADC, the yellow line on the right reflected the same usage pattern but recorded by INA219. There is a very drastic difference in noise fluctuations between the two graphs! The ESP32 ADC plot was a little jagged and perfectly fine for my purpose, but it was a real treat to see INA219 values tracing out a smooth curve with no visible noise. At least, at the scale of my graph. This improvement should help as I move on to the next step of my project.

Exploring Low Power ESPHome Nodes

When I investigated adding up power over time into a measure of energy, I found that I have the option of doing it either on board my ESPHome microcontroller or on the Home Assistant server. I’m personally in favor of moving as much computation on the server as I can, and another reason is because keeping the sensor node lightweight gives us the option of putting it to sleep in between sensor readings.

Preliminary measurements put this MP1584EN + ESP8266 + INA219 at a combined average power draw of somewhere around a quarter to a third of a Watt. This is pretty trivial in terms of home power consumption, but not if there is ambition to build nodes that run on battery power. For example, let’s do some simple math with a pair of cheap NiMH rechargeable AA batteries. With a nominal capacity of 2000 mAh and nominal voltage of 1.2V each, that multiplies out (1.2 V * 2 Amps 1 hour * 2 batteries) to 4.8 Watts over an hour. Actual behavior will vary a lot due other variables, but that simple math gives an order of magnitude. Something that constantly draws 0.3 Watt would last somewhere on the order of (4.8 / 0.3) 16 hours, or less than a day, on a pair of rechargeable AA NiMH batteries.

ESPHome has options for putting a node into deep sleep, and the simplest options are based on time like running for X seconds and sleep for Y minutes. For more sophisticated logic, a deep_sleep.enter action is exposed to enter sleep mode. There is also a deep_sleep.prevent action to keep a node awake, and the example is to keep a node awake long enough to upload a code update. This is a problem I’ve tripped over during my MicroPython adventure and it’s nice to see someone has provided a solution in this framework.

The example code reads retained value on a MQTT topic to decide whether to go to sleep or not. I think this is useful, but I also want a locally controlled method for times when MQTT broker is unreachable for any reason. I wanted to dedicate a pin on the ESP8266 for this, with an internal pull-up and an external switch to pull to ground. When the pin is low, the node will go to sleep as programmed. If the pin is high, the node stays awake. I will wire this pin to ground via a jumper so that when the jumper is removed, the node stays awake. And if the jumper is reinstalled, the node goes to sleep.

Such GPIO digital activity can be specified via ESPHome Binary Sensor:

deep_sleep:
  run_duration: 30s
  sleep_duration: 2min
  id: deep_sleep_1

binary_sensor:
  - platform: gpio
    name: "Sleep Jumper"
    id: sleep_jumper
    pin:
      number: 13
      mode:
        input: true
        pullup: true
    on_press:
      then:
        - logger.log: "Preventing deep sleep"
        - deep_sleep.prevent: deep_sleep_1
    on_release:
      then:
        - logger.log: "Entering deep sleep"
        - deep_sleep.enter:
            id: deep_sleep_1
            sleep_duration: 1min

But this is not quite good enough, because on_press only happens if the high-to-low transition happens while the node is awake. If I pull the jumper while the node is asleep, upon wake the pin state is low and my code for high-to-low transition does not run. I needed to check the binary sensor state elsewhere before the sleep timer happens. In the case of this particular project, I also used the analog pin to read battery voltage once every few seconds, so I removed the check from on_press to ADC sensor on_value. (I left on_release code in place so it will still go to sleep when jumper is reinstalled.)

sensor:
  - platform: adc
    pin: A0
    name: "Battery"
    update_interval: 5s
    on_value:
      if:
        condition:
          binary_sensor.is_on: sleep_jumper
        then:
          - logger.log: "Preventing deep sleep"
          - deep_sleep.prevent: deep_sleep_1

This performs a jumper check every time the ADC value is read. This is pretty inelegant code, linking two unrelated topics, but it works for now. It also avoids the problem of digital signal debouncing, which would cause on_press and on_release to both be called in rapid succession unless a delayed_on_off filter is specified.


Ideally, this sensor node would go to sleep immediately after successfully performing a sensor read operation. This should take less than 30 seconds, but the time is variable due to external conditions. (Starting up WiFi, connect to router, connect to Home Assistant, etc.) The naive approach is to call deep_sleep.enter in response to on_value for a sensor, but that was too early. on_value happens immediately after the value is read, before it was submitted to Home Assistant. So when I put it to sleep in on_value, Home Assistant would never receive data. I have to find some other event corresponding to “successfully uploaded value” to trigger sleep, and I haven’t found it yet. The closest so far is the Home Assistant client api.connected condition, but that falls short on two fronts. The first is that it does not differentiate between connecting to Home Assistant (useful) versus ESPHome dashboard (not useful). The second is that it doesn’t say anything about success/failure of sensor value upload. Maybe it’s possible to do something using that condition, in the meantime I wait 30 seconds.

A quick search online found this person’s project also working to prolong battery life for an ESP8266 running ESPHome, and their solution is to use MQTT instead of the Home Assistant communication API. I guess they didn’t find an “after successful send” event, either. Oh well, at least I’m getting data from INA219 between sleep periods, and that data looks pretty good.

Adding Up Power in ESPHome and Home Assistant

Using an INA219 breakout board, I could continuously measure voltage and current passing through a circuit. Data is transmitted by an ESP8266 running ESPHome software and reported to Home Assistant. In order to avoid getting flooded with data, we can use ESPHome sensor filters to aggregate data points. Once we have voltage and current, multiplying them gives us power at a particular instant. The next step is to sum up all of these readings over time to calculate energy produced/consumed. We have two methods to perform this power integration: onboard the microcontroller with ESPHome, or on the Home Assistant server.

ESPHome

The Total Daily Energy component accumulates value from a specified power sensor and integrates a daily tally. (It also needs the Time component to know when midnight rolls around, in order to reset to zero.) The downside of doing this calculation on the controller is that our runny tally must be saved somewhere, or else we would start from zero every time we reset. By default, the tally is saved in flash memory every time a power reading arrives. If power readings are taken at high frequency, this could wear out flash storage very quickly. ESPHome provides two parameters to mitigate wear: we could set min_save_interval to a longer duration in order to reduce the number of writes, or we could set restore to false and skip writing entirely. The former means we lose some amount of data when we reset, the latter means we lose all the data. But your flash memory will thank you!

Home Assistant

Alternatively, we can perform this calculation on Home Assistant server with the unfortunately named integration integration. The first “integration” refers to the math, called Riemann sum integral. The second “integration” is what Home Assistant calls its modules. Hence “integration integration” (which is also very annoying to search for).

Curiously, I found no way in Home Assistant user interface to add this to my instance, I had to go and manually edit configuration.yml as per documentation. After I restarted Home Assistant, a new tally started counting up on my dashboard, but I could not do anything else with the user interface element. I just get an error “This entity does not have a unique ID“.

On the upside, doing this math on the server meant data in progress will be tracked and saved in a real database, kept on a real storage device instead of fragile flash memory. But by default it does not reset at midnight, so the number keeps ticking upwards. Doing more processing with this data is on the to-do list.


Should we do our computation on the microcontroller or on the server? There are certainly advantages to either approach, but right now I lean towards server-side because that lets us put the microcontroller to sleep.

ESPHome Sensor Filters Help Manage Flood of Data

I was happy to find that ESPHome made building a sensor node super easy. Once my hardware was soldered together, it took less than ten minutes of software work before I was looking at a flood of voltage and current values coming in from my ESP8266-based power sensor.

It was a flood of data by my decision. Sample code from ESPHome INA219 documentation set data refresh rate at once every sixty seconds. I was hungry for more so I reduced that to a single second. This allowed me to see constantly updating numbers in my Home Assistant dashboard, which is satisfying in a statistics nerd kind of way, but doing so highlighted a few problems. Home Assistant was not designed for this kind of (ab)use. When I click on a chart, it queries from SQLite and took several seconds to plot every single data point on the graph. And since there are far more points than there are pixels on screen, what I get is a crowded mess of lines.

For comparison, InfluxDB and Grafana were designed to handle larger volumes of data and gives us tools for aggregating data. Working with aggregates for analysis and visualization avoids bogging the system down. I’m not sure how to do the same in Home Assistant, or if it’s possible at all, but I do know there are data aggregation tools in ESPHome to filter data before it gets into Home Assistant. These are described in the Sensor Filters documentation. I could still take a reading every second, but I could choose to send just the average value once a minute. Or the maximum value, or the minimum value. Showing average value once a minute, my Home Assistant UI is responsive again. The graph above was for the day I invoked this once-a-minute averaging, and the effect is immediately visible roughly around 10:45PM.

The graph below was from a later day when once-a-minute average was active the entire day:

It is a cleaner graph, but it does not tell the whole story. I had used this INA219 sensor node to measure power consumption of my HP Stream 7 tablet. Measuring once a second, I could see that power use was highly variable with minimum of less than two and a half watts but spikes up to four and a half watts. When showing the average, this information was lost. The average never dropped below 2.4 or rose above 3.2. If I had been planning power capacity for a power supply, this would have been misleading about what I would need. Ideally, I would like to know the minimum and the maximum and the average over a filtered period. If I had been writing my system from scratch, I know roughly what kind of code I would write to accomplish it. Hence the downside of using somebody else’s code: it’s not obvious to me how to do the same thing within this sensor filter framework. I may have to insert my own C code using ESPHome’s Lambda mechanism, something to learn later. [UPDATE: I learned it later and here’s the lambda/template code.] In the meantime I wanted to start adding up instantaneous power figures to calculate energy over time.

Using INA219 Was Super Easy with ESPHome

Once I had ESPHome set up and running, the software side of creating a small wireless voltage and current sensor node with was super easy. I needed to copy sample code for I2C bus component, then sample code for INA219 component, and… that’s it. I started getting voltage, current, and power reports into my Home Assistant dashboard. I am impressed.

It was certainly far less work than the hardware side, which took a bit of soldering. I started with the three modules. From left to right: the INA219 DC sensor board, the MP1584EN DC voltage buck converter, and the ESP8266 in a Wemos D1 Mini form factor.

First the D1 Mini received a small jumper wire connecting D0 to RST, this gives me to option to play with deep sleep.

The MP1584EN was adjusted to output 3.3 volts, then its output was wired directly to the D1 Mini’s 3V3 pin. A small piece of plastic cut from an expired credit card separated them.

The INA219 board was then wired in a similar manner on the other side of D1 mini, with another piece of plastic separating them. For I2C wires I used a white wire for SDA and green wire for SCL lines following Adafruit precedence. Vcc connected to the 3.3V output of MP1584EN in parallel with D1 mini, and ground wires across all three boards. The voltage input for MP1584EN was tapped from Vin- pin of the INA219 board. This means the power consumed by ESP8266 would be included in INA219’s measurements.

A small segment of transparent heat shrink tube packed them all together into a very compact package.

I like the concept of packing everything tightly but I’m squeamish about my particular execution. Some of the wires were a tiny bit longer than they needed to be, and the shrink tube compressed and contorted them to fit. If I do this again, I should plan out wire my lengths for a proper fit.


Like I said earlier, the hardware took far more time than the software, which thanks to ESPHome became a trivial bit of work. I was soon staring at a flood of data, but thankfully ESPHome offers sensor filters to deal with that, too.

Notes on Running ESPHome Dashboard

Once I got Home Assistant running on my home server, I launched an ESPHome container to run alongside and pointed Home Assistant to that container via ESPHome integration. After running it for a while, here are some notes.

Initial Setup Required USB

The primary advantage of this approach is that I have an always-on dashboard for my ESPHome devices, from which I could edit and upload new firmware wirelessly. The primary downside of this approach is that I couldn’t route USB port to this docker instance, so I needed another computer to perform initial firmware flash with USB cable. There are a few options: (1) select “Manual Install” to download a binary file that I would then flash with esptool.py. Advantage: esptool is easy to install. Disadvantage: I have to remember all of the other parameters for flashing. Option (2) copy the configuration YAML file and run a separate instance of ESPHome on the computer with USB port. Advantage: ESPHome took care of all flashing parameters, no need to remember them. Disadvantage: ESPHome not as easy to install. Option (3) select “Manual Install” to download a binary, then use https://web.esphome.io/ to flash. Advantage: zero setup!

ESPHome /cache Directory

In addition to the required /config directory, we could optionally mount a /cache directory to ESPHome container instance. When present, the directory is used for items that are easily replaceable. For example downloading PlatformIO binaries and intermediate files during compilation. My /config directory is mapped to a ZFS hard drive array. It is regularly backed up so I have a history of my configuration YAML files, but it is not fast. So I mapped /cache to a SSD volume which is fast but not regularly backed up. It also gets quite large, after a few experiments I approached a gigabyte under /cache versus only a few megabytes in /config.

Not Actually Required for Home Assistant

I had thought ESPHome dashboard served as communication node for all my ESP32/ESP8266 boards to talk to Home Assistant. I was wrong! The boards actually get all the code to talk to Home Assistant directly. This meant I don’t strictly need to have Home Assistant Core and ESPHome Dashboard launch together in a common docker-compose.yml file. Home Assistant Core needs to be running, but ESPHome Dashboard could be launched just when I want to wirelessly modify a node.

Add Dashboard Password

But if ESPHome will always be left running as a standalone container, it would be a very good idea to install a minimum bar of security protection. By default, ESPHome dashboard is openly accessible, and I didn’t think it was the best idea. It left open access of all my ESPHome nodes to any port sniffers that might get on my home network. Whether I leave ESPHome running or not, I should at least add a username and password to ESPHome dashboard. This can be done by modifying the container launch commands as per parameters in ESPHome documentation.

version: '3'

services:
  esphome:
    image: esphome/esphome:latest
    command: dashboard --username [my username] --password [my password] /config
    restart: unless-stopped
    volumes:
      - [path to regularly backed-up volume]:/config
      - [path to speedy SSD that isn't backed-up]:/cache
    network_mode: host

This would not be necessary if running as an add-in with Home Assistant Operating System. When installed and managed by the supervisor, access to the ESPHome dashboard becomes part of Home Assistant user control.


All this effort to learn Home Assistant and ESPHome was kicked off when I decided not to write my own code to work with an INA219 voltage+current sensor, hoping it would be easier to use ESPHome instead. And I’m happy to report it absolutely paid off.

Hello Home Assistant

I have an existing home server set up to run Docker containers, it’s how I’ve been trying out tools like InfluxDB. I added an instance of Home Assistant Core to the list of running containers. When the first screen came up, I was happy to see that it required me to create a username and password before doing anything else. It’s the minimum bar of security, far better than leaving it openly accessible to anyone to probe a known port.

Once I got through initial setup, I was shown the “Overview” dashboard. We can create our own dashboards, but the system starts with this one. It was automatically generated, and by default it is also managed automatically to show everything that pops up. It was populated by a metrological (weather) widget, set to the home location specified during initial setup. I infer this was done so anyone starting fresh with Home Assistant has at least one item to interact with. (Of course, with the focus on local control, Home Assistant has a “Depends on Cloud” label/disclaimer/warning on such features, because it depends on weather data published online.) With weather as starting point, I could add more cards representing devices that already existed on my home network.

The TV was not the only device visible via multiple integrations. My home wireless router was made by Asus, and by default it was visible to the Universal Plug-and-Play Internet Gateway Device integration. However, I disabled that in favor of a more device-specific AsusWRT integration. The latter took a bit more work, as I had to generate a SSH keypair for secure connection between Home Assistant and the router. The public key was pasted into the router’s “Administration” control panel, in the “System” tab, under the “Service” section. I also had to enable SSH (LAN only) and I took the option to change to a nonstandard port.

Once these integrations were added, their associated entities were automatically added to the “Overview” dashboard. This was a lot of data. In fact, I think it is too much data! Thus my first lesson in using Home Assistant is going into the entities list and disabling them. For example, at the moment I don’t see a reason why I needed to know whether my TV is connected via Ethernet or wireless, so I disabled that particular entity. I appreciated the power of having all of these entities at my disposal, but this data overload is also why Home Assistant is not exactly considered beginner friendly.

Anyway, getting my feet wet with Home Assistant was fun, but ESPHome is the reason I’m here.

Notes on Home Assistant Core Docker Compose File

I’m playing with Home Assistant and I started with their Home Assistant Core Docker container image. After a week of use, I understood some of the benefits of going with their full Home Assistant Operating System. If I like Home Assistant enough to keep it around I will likely dig up one of my old computers and make it a dedicated machine. In the meantime, I will continue evaluating Home Assistant by running Home Assistant Core in a container. The documentation even gave us a docker-compose.yml file all ready to go:

version: '3'
services:
  homeassistant:
    container_name: homeassistant
    image: "ghcr.io/home-assistant/home-assistant:stable"
    volumes:
      - /PATH_TO_YOUR_CONFIG:/config
      - /etc/localtime:/etc/localtime:ro
    restart: unless-stopped
    privileged: true
    network_mode: host

This is fairly straightforward, but I had wondered about the last two lines.

    privileged: true

First question: why does it need to run in privileged mode? I couldn’t find an answer in Home Assistant documentation. And on the other end, official Docker compose specification just says:

privileged configures the service container to run with elevated privileges. Support and actual impacts are platform-specific.

So the behavior of this flag isn’t even explicitly defined! For the sake of following directions, my first launch of Home Assistant Core image specified true. Once I verified it was up and running, I took down the container and brought it back up without the flag. It seemed to work just fine.

One potential explanation: upon initial startup, Home Assistant needed to create a few directories and files in the mapped volume /config. Perhaps it needed the privileged flag to make sure it had permissions to create those files and set their ownership properly? If so, then I only needed to run with the flag for first execution. If not, then that flag may be completely unnecessary.

    network_mode: host

Second question: why does it need to run in host network mode? Unlike privileged, network mode is much better defined and host means “gives the container raw access to host’s network interface”. I tried running Home Assistant Core with and without this flag. When running without, Home Assistant could no longer automatically detect ESPHome nodes on the network. Apparently auto-discovery requires running in host network mode, and it’s a big part of the convenience of ESPHome. In order to avoid the tedium of getting, tracking, and typing in network addresses, I shall keep this line in my Docker compose file while I play with Home Assistant Core.

Notes on Home Assistant Core vs Home Assistant Operating System

Once I decided to try Home Assistant, the next decision is how to run it. Installation documentation listed many options. Since I’m in the kick-the-tires trial stage, I am not yet ready to dedicate a computer to the task (not even a Raspberry Pi) so I quickly focused on running Home Assistant inside a virtualized environment on my home server. But even then, that left me with two options: run Home Assistant Core in a Docker container, or run Home Assistant Operating System in a virtual machine.

Reading into more details, I was surprised to learn that both cases run Home Assistant Core in a Docker container. The difference is that Home Assistant Operating System also includes a “Supervisor” module that helps manage the Docker instance, doing things like automatic updates (and rollback in case of failure), making backups, and setting up additional Docker instances for Home Assistant add-ons. (ESPHome dashboard is one such addon.) If I opt out of supervisor to run Home Assistant Core on my existing Docker host, I will have to handle my own updates, backups, and add-ons.

Since I already had a backup solution for data used by Docker containers running on my server, I decided to start by running Home Assistant Core directly. After running in this fashion for a week, I’ve learned a few facts in favor of running Home Assistant Operating System on a physical computer:

  • Home Assistant Core updates very frequently, three updates in the first week of playing with it. Thanks to Docker it’s no great hardship to pull a new image and restart, but it’d be nice to have automatic rollback in case of failure.
  • When browsing the wide selection of Home Assistant integrations, there’s usually a little “Add Integration” button that held the promise to automatically set everything up for us. When the thing is an addon that requires running its own Docker container (like the ESPHome dashboard) the promise goes unfulfilled because we’d need the supervisor module for that.
  • When managed by the supervisor, addons like ESPHome can be integrated into the Home Assistant user interface. Versus opening up a separate browser tab when running in a Docker container I manage manually. This also means an addon can integrate with Home Assistant permissions so there’s no need to set up a separate username and password for access control.
  • Some addons like the ESPHome dashboard requires hardware access. In the case of ESPHome, a USB cable is required for flashing initial firmware on an ESP8266/ESP32. Further updates can be done over the network, but that first one needs a cable. Some Docker hosting environments allow routing a physical USB port to the Docker instance, but mine does not.

I could work around these problems so none of them are deal-breakers. But if I like Home Assistant enough to keep it around, I will seriously consider running it on its own physical hardware. Whether that’d be a Raspberry Pi or something else is to be determined.

In the meantime, I will continue running Home Assistant Core in a container. The documentation even gave us a docker-compose.yml file all ready to go, but I was skeptical about running it as-is.

Changing Project Direction to Use INA219 Power Monitor

I’ve had fun playing with MicroPython on an ESP8266, having an exception handling framework was especially welcome. I had originally intended to continue playing with MicroPython, gradually increasing the project complexity at each step, but I’ve changed my plan. The catalyst of this decision was a little breakout board for the Texas Instruments INA219 chip which measures electrical voltage (up to 26V DC), current (variable range depending on shunt resistor used), plus a built-in calculator for power (in Watts) from those two values. I bought mine off Amazon but I’ve since learned it was a knockoff of this Adafruit product so I’ll link to the original.

I had sat down with reference materials in front of me: the INA219 datasheet and the MicroPython I2C library. Then I felt a familiar sensation: that of my attention and enthusiasm fading. I know this sensation well! It stalled many projects in the past, and it is a warning sign I need to change directions fast or this project will stall as well.

I realized I was not enthusiastic about writing a MicroPython library for INA219 from scratch. There is educational value in doing so for sure, but for whatever reason right now I don’t feel the motivation I needed to reinvent this particular wheel. I went online looking for an existing solution and found a MicroPython Forum thread from someone who has done this work, pointing to their GitHub repository for the library.

Side note: Reading documentation for running this library on an ESP8266, I learned something interesting: the ESP8266 may encounter problems translating large MicroPython projects into executable code. The workaround is to use the MicroPython cross-compiler mpy-cross on my desktop and copy the resulting bytecode for execution on board the ESP8266.

If I could get this library up and running, I could see how to report resulting values to MQTT. Then I could perform calculations in Node-RED, and log calculated results into InfluxDB. Then I could start writing the infrastructure to read this data and make decisions on what to do in response. This is going to be a respectably large project and I don’t feel enthusiasm to do that, either! Apparently I’m not in the mood to learn by reinventing wheels, so I started looking to see what others have already done.

ESP8266 MicroPython Simple MQTT Client

I’ve got my second voltage monitoring ESP8266 up and running. Power comes from my lead-acid battery array stepped down with a DC buck converter, and data communication is over WiFi. I could work with MicroPython over WiFi using WebREPL, where I confirmed I can obtain a value from ESP8266 ADC. Next step: report that ADC value via MQTT.

The instance of Mosquitto MQTT broker I’ve got running in a docker container is password restricted, so I called docker exec on my running Mosquitto container to obtain a command line inside the container, and from there run mosquitto_passwd tool to create a username and a password for this ESP8266.

Then I have to figure out how to make use of that new name and password. I had assumed there would be a MQTT client library for MicroPython and I was correct. In fact, there were several! One of my top web search results went to a page on Random Nerd Tutorials, which used umqttsimple.py. That probably would have worked, but it hasn’t been updated in three years so I looked for something more recent. Continuing my search, I found a MQTT page on documentation for the mPython board. It’s not the hardware I’m using but from that page I learned MicroPython developers maintain a GitHub repository micropython-lib for useful MicroPython code libraries outside of core MicroPython project. This collection of libraries included a simple MQTT client.

Running the MQTT publish example, an exception was raised when I called connect(). This is a minimalist library so the MQTTException class was equally minimal: only a value of 5 was returned as the error code. It’s not very descriptive but I had guessed it was because the example code didn’t include the username and password I had setup for this client. Putting those in eliminated exception 5, which is good, but now I’m looking at a different exception: 2. I have no further guesses and need to go online for research.

Finding the MQTT specification online, I went to the section describing return code values for MQTT connect. This table listed 5 as “not authorized” which makes sense for lack of username and password. But error 2 is “identifier rejected” which is a puzzle. Officially, the error condition is “The Client identifier is correct UTF-8 but not allowed by the Server” but my client identifier is a straightforward string. Trying a few different client identifier strings didn’t make a difference. Suspecting it’s a problem in my MQTT broker, I tried the Mosquitto public test server and got the same error. What’s going on?

The answer is a known bug in this simple MQTT library, filed as issue #445. Apparently a recent release of Mosquitto tightened up spec compliance requirements and this simple MQTT library does not conform. It has something to do with keepalive and specifying zero is no longer tolerated. Specifying a nonzero value allowed my connection to succeed without error, but I understand it is only a hack because I’m not actually doing any of the other work to actually keep alive at my specified interval. Since this particular project is going to report an ADC value and immediately go into deep sleep, it also means I would immediately disconnect from Mosquitto MQTT broker and disconnect from WiFi. So I don’t think I’ll get in trouble for lying with a keepalive interval, as long as I bail before my lie causes a problem.

But this little adventure with MQTTException reminded me of one advantage of using MicroPython: getting access to exception handling mechanisms!

Making a USB Data-Only Cable

My current microcontroller project uses a development board that has built-in hardware to take both power and programming/debugging data over USB. But I want to connect it to another power source, which means I need to disconnect USB power in order to avoid potential problems from dueling voltage regulators on the same voltage plane. My first attempt used a small jumper on the circuit board, but it looks pretty accident-prone, so I went with the backup plan: a USB data-only cable.

I hate having to resort to this solution, as I hate having USB cables that don’t do what I thought they did. This hatred was bred by USB power-only cables. They are frequently bundled with small electronics that charge their batteries via USB power and have no need for USB data communication. The problem is that these cables look identical to normal USB cables and it’s too easy to use them elsewhere not realizing they are power-only. I have spent far too much time debugging device communication issues only to realize my problem was a USB power-only cable in the mix.

A data-only cable is the same kind of cursed, but in reverse. Unfortunately, it is what I need now if I wish to debug a development board that already has its own power source. USB data communication is a differential signal protocol, so we really need only the two data lines. They are usually labeled D+ and D- on a diagram. When we cut open a wire, the convention is to have D+ on the green wire and D- on the white wire.

Black is ground by convention, and red wire for +5V USB power. I took one of my micro-USB cables and cut it open to expose these wires, then I cut the red wire. The nature of differential signals means their voltage difference relative to ground isn’t as critical, but I need to leave ground wire intact to make sure the ground planes on either end don’t drift too far apart. With the +5V line cut, there shouldn’t be much electrical current flowing through the ground line.

This serves my purpose but it isn’t great. For one thing, it confuses my computer. Apparently having three out of four wires alive triggers USB device insertion alert. When the cable is connected to the development board with its own power, everything works as expected. But when it’s just the cable without the board, Windows throws up an “Windows doesn’t recognize the last USB device you plugged in” alert. This tells me it is doing other weirdness behind the scenes. I hope it doesn’t damage the computer, and I’ll try to make sure I don’t plug the cable in by itself.

On the upside, the damaged insulation makes it pretty obvious I’ve hacked on this USB cable. I doubt I would ever unknowingly use this cable so I should never expect USB power from this data-only cable.

I hated having to do this, but this hacked-up cable will serve until I have a better idea. In the meantime, work can continue on my ESP8266 solar panel voltage monitor project.

Microwave Water Heating Tests

Microwave ovens have become a fixture in kitchens, offering a convenient way to heat or reheat foods quickly and efficiently. Internet opinions on their expected lifespan range somewhere from seven to ten years. Recently, my reheated leftovers occasionally came out cooler than expected. Is my microwave failing?

As always, the first step is to find documentation. Looking at the manufacturer’s plate at the back, I find it is a Sharp R-309YK. A PDF manual for R-309Y model line is available for download from Sharp. (The “K” at the end designated the color, which is black in my case.) I had hoped the manual would have a “Troubleshooting” section, as appliance manuals sometimes do, but not this one. The identification plate also said the microwave was manufactured in December 2014. Since we’ve passed the seven-year anniversary, a failure would be unfortunate but not completely unreasonable.

Absent a troubleshooting section in the manual, I went online and found several tests for microwave effectiveness by heating water. In increasing order of credibility in my book, the results were:

Test #1: Wikihow = Fail

This test heats two cups of water on high for one minute and measures the temperature difference before and after. A healthy microwave is expected to raise the temperature by 35 to 60 degrees Fahrenheit. Using my food thermometer I measured the starting temperature at 64.9F, ended at 90.0F, for a rise of 25.1F. This is lower than the accepted range.

Test #2: GE Appliances = Pass

This test doubles the amount of water to one quart, and more than doubles the heating time to two and a half minutes. Despite proportionally longer heating time, this test had lower expectation on heating with a target range of 28 to 40 degrees Fahrenheit. My test started at 69F and ended at 34F, right in the middle of the target range.

Test #3: USDA = Pass

This test is a little different than the other two. The quantity of water is smaller: only one cup, but the heating procedure is different. Instead of measuring temperature rise over a fixed time duration, we are going from freezing to boiling temperatures and measuring the time elapsed. The water started showing small bubbles at two and a half minutes, and a full roiling boil at three minutes. Based on a lookup chart accompanying this test, this is consistent with a microwave in the range of 700 to 800 Watts. Lower than the advertised 1000 Watt but still within the usable range.

Result: Two Out of Three

My microwave passed two of three tests. Furthermore, since I place more credibility with USDA and GE than whoever authored the Wikihow article, I’m inclined to put more weight in those results. It appears that my microwave is functional, at least nominally. But then how might I explain the lower-than-expected heating I experienced?

Unknown Cycling

The best guess is a behavior difference I noticed during these tests. They are all heating water on high power setting, which means everything should be running at full power at all times. But during normal use, something is cycling on-and-off. I could hear a change in sound, and the interior light would flicker. The magnetron is expected to cycle on-and-off during a partial power reheat, but not when it is set to full power.

Looking online for potential explanations, I read the magnetron may turn off for a few seconds if it got too hot. This could happen, for example, when there’s not quite enough food in the microwave to absorb all the energy. If that was the case, however, I thought my food would be piping hot. My current hypothesis: something is triggering a self-protection mode during normal use, but not during these water heating tests. I’ll keep my eyes open for further clues on microwave behavior… and also keep my eyes open for discounts on 1000-Watt microwaves.

Unity Machine Learning Agents Almost Within My Reach

While poking around Google’s Machine Learning Crash Course, I found that they have released a TensorFlow library for building agents with deep reinforcement learning. This might be fun but I don’t know enough about the field to make use of that library yet. It also reminded me to take another look at game engine Unity 3D’s development in this area. A lot has happened!

I first took a quick glance at Unity ML-Agents more than two years ago. At the time, the project was still an experimental thing for Unity and a lot was still in flux. Since I didn’t know much about working in Unity or in reinforcement learning, that was too many variables in flux for my taste. A year later, Unity ML-Agents reached an official version 1.0, but it was still technically a preview technology. But not long after that they had become a “verified” package for use with Unity 2020.3 LTS build, signifying a mature tool. As part of being a verified package for use with Unity LTS, ML-Agents got some nice things like an official Unity technology landing page and a few pieces of curriculum have been posted to Unity Learn to help people get started.

The primary focus of Unity ML-Agents is for creating agents in the virtual world of a Unity game. Not necessarily for real-world robots which is where my interests lie. This is an important caveat because the Unity physics engine is not an accurate representation of the real world, and reinforcement learning agents are notorious for exploiting flaws in virtual engines to do “impossible” things. But that’s no reason to give up on Unity, which can still be a useful tool for robotics research. These caveats are just some tradeoffs amongst many more to keep in mind.

During this time that Unity evolved their ML-Agents library, I’ve occasionally dabbled in Unity with projects like Bouncy Bouncy Lights. I’m not bold enough to call myself a Unity developer yet, but I’m no longer completely overwhelmed by Unity editor user interface as I once were. I haven’t done much more in Unity because I haven’t felt particularly motivated to make games. But ML-Agents? That looks like pretty good motivation for me to put serious effort into understanding reinforcement learning.

Chunghwa CLAA133UA01 Circuit Board and LED Backlight

I tried and failed to salvage the polarizer film of a Chunghwa CLAA133UA01 display panel, but that wasn’t the primary objective anyway. I turned to the real goal of salvaging its LED backlight and the first step is to remove the perimeter protective film. Most of my prior salvaged panels were held together with thin black plastic tape, this panel is slightly different in its use of shiny metallic foil tape. I was surprised to see it, as I thought foil would short-circuit the components underneath. Perhaps it is some sort of metallized plastic instead of metal foil. This stuff rips more easily than others but at least its adhesive still came off cleanly.

Once the foil was removed, I could see three important-looking chips on the circuit board.

Closest to the cable connector is a chip marked MST7337F-A AQ2T842B 1049B. A web search found Kynix Semiconductor MST7337 which is a chip for NTSC/PAL/SECAM automotive TV applications. I don’t think this is the right chip, but the correct answer eludes me. I might have better luck if I knew the logo, which is distinctive but not one I recognize. I didn’t see that logo on the Kynix Semiconductor page.

The next chip was marked AAT11771 A2U274 1052. A web search found a hit: Advanced Analog Technology AAT11771 is a controller for driving TFT LCD displays.

The third important-looking chip was marked A706B A38T 66040. Its proximity to the LED backlight connector makes it a prime candidate for the LED driver, it’s even next to the inductor + capacitor pairing consistent with a boost converter to raise voltage high enough to drive strings of LEDs. A search for A706B found that A706 is a standardized grade of steel bars for concrete reinforcement, but I saw nothing about a LED driver chip.

Pulling up the backlight connector for a look, I can see there are five thin conductors, one per contact point plus one thick conductor using three contact points. Remaining contact points between them are apparently unused. Based on what I’ve seen on other panels, I guessed the thick conductor is a common source for five current sinks for five parallel strings of LEDs.

This hypothesis was quickly and easily tested with a LED tester, so if I never manage to find information on that LED driver chip I should at least be able to drive these strings directly via copious test points visible in that area of the circuit board.

Until I find need for another diffused LED light source, this is a good stopping point. I put the LED backlight back into storage and pulled a non-dead panel out of my hardware archives. This one is still attached to a nominally working HP Stream 7 tablet.

Chunghwa CLAA133UA01 Polarizer Glue Stronger Than Polarizer Film

After verifying I could illuminate LED strings of a LG LPP133WH2(TL)(M2) salvaged from a Dell laptop, I set it aside to work on the final panel in my stack of LCD laptop panels. This was salvaged from a Sony VAIO laptop whose model number I no longer know.

The original owner had spilled some cola on it. Good news: the spill did not immediately kill the machine so data could be pulled off averting any loss of data. Bad news: the computer started failing intermittently in strange ways as corrosion took hold, and eventually died a few weeks after the initial spill.

Removing the panel I see a label with designation Chunghwa CLAA133UA01. (Along with some dried coke residue.) Web lookup indicated this is a LED-backlit panel with 1600×900 resolution. Better than the 1366×768 resolution we see on baseline laptops today, but still short of full 1920×1080 resolution. Like the rest of my stack of panels, I decided it was not interesting enough to revive as a display.

My first task was removing the polarizer film in the front of the display, something I have yet to perfect through several past experiments. So far I’ve been able to remove the film in one piece but failed to clean off adhesive residue. For this panel, I didn’t even get that far. This panel used glue that was very strong, apparently stronger than the tensile strength of the polarizer film! Roughly a quarter of the way through peeling, the film tore apart and I decided to abandon polarizer retrieval.

Looking at the tear was mildly interesting. It was a zig-zag pattern instead of a straight line. This material is weakest at plus or minus 45 degrees relative to screen viewing orientation. Does that have any relation to polarization angle, or is it indicative of something else? I don’t have any tools to probe that question so I will set it aside for now and move on to the LED backlight.

LED Backlight of LG LP133WH2 (TL)(M2) Laptop LCD Panel

I’m pulling apart some retired laptop LCD panels. For the latest panel, I decided to work on the polarizer film first and I was encouraged by those results. I’ll probably try the polarizer first for future panels. But before I move on to the next panel, I want to get a closer look at the LED backlight from this panel I pulled from a retired Dell laptop. The label says it is a LG Display LP133WH2 (TL)(M2) module. A quick internet search says its pixel resolution is 1366×768, which is pretty low by today’s standards and not worth the effort to bring back online as a computer display.

Like many previous modules, it had tape all around. Unlike some previous modules, there are several different types of tape involved.

Peeling back the tape, I could see the backlight connector in the center. The previous few panels had them to the side. I’m not sure what design tradeoffs are involved in the different placements.

The chip footprint closest to the backlight connector is unpopulated. This is usually a sign there’s another version of the device with enhanced features, but I’m not sure how that works for a display module like this. Whatever it may be, the absent chip is certainly not the backlight LED controller.

The other chip on this side of the circuit board is labeled LG SW0641A. I’m amused that my not-helpful search results included a LG clothes washer with that model number. I’m not sure what this is, but it is definitely not a clothes washer. It is probably the main display controller that talks to the rest of the laptop.

Flipping the panel over, high density data connectors for the LCD array are visible as well as two chips.

Searching for information on a SiW SW5024, I came across vendors willing to sell them but not much else.

But that doesn’t matter, because a search for ADD 5201 written on the other chip resulted in a pointer to a “High Efficiency, Eight-String White LED Driver for LCD Backlight Applications” by Analog Devices. Jackpot!

While the chip can drive up to eight strings, it appears we only have four on this panel. I see a VOUT_LED test point that fans out to four conductors on this connector. And I also see test points corresponding to four strings. FB1 is to the left, below VOUT_LED. FB2, FB3, and FB4 are to the right. If it follows convention of other panels, VOUT_LED would be the current source and FB1 through FB4 are sinks for each of four parallel strings of LEDs.

Probing those points with a LED tester confirmed the hypothesis, and highlighted another difference on this panel. Previous panels with parallel strings of LEDs would interleave them across the bottom. With an interleaved design a single failed string would still leave most of the display illuminated. But in this panel, each of these four strings are assigned a quarter of the panel area. So if one string failed, one quarter of the display would be darkened and difficult to read. My guess is this method is easier (and cheaper) to wire as a tradeoff for fault tolerance.

With the LED strings verified to illuminate, I set this aside and started working on the final disembodied laptop display panels currently in my possession: a Chunghwa CLAA133UA01 from a Sony VAIO laptop.

Start with Polarizer Film Transfer

I’ve been interested in salvaging the polarizer film from a LCD panel but I’ve had problems removing the glue without destroying the film. I had the idea to leave the glue in place but transfer it to something else that is clear, like a sheet of acrylic. I wouldn’t call my first experiment a success, but it was encouraging enough for me to start with the film for my next salvaged laptop LCD panel.

There were two advantage I hoped to gain by pulling that sheet while the LCD module is still intact. First is physical strength, as the glass still has all of its reinforcements and I hope it will be less likely to break as I pull on the polarizer film. Second is thermal inertia, I’ve learned that a thin sheet of glass cools too quickly. By leaving the module intact I hoped it would stay hot longer.

The next LCD panel was salvaged from a Dell laptop whose model number I no longer remember. (Possibly a Vostro 3350?) It had a lovely bronze surface finish so I also kept the mounting frame for this panel.

Just like before, I left it out in the Southern California summer sun to soften the glue.

A razor blade got me started in a corner.

A ruler was used to give me a flat edge to hold against the glass, which along with keeping the module intact meant I didn’t break this LCD glass during polarizer film removal.

And just my luck, the glue for this particular sheet isn’t particularly tenacious and didn’t want to stick to the acrylic. And where it did stick, it wasn’t as optically clear as previous films.

A little bit of mineral spirits helped the glue settle against the acrylic. Still not optically clear, but I’m pleased with my progress on reducing surface imperfections.