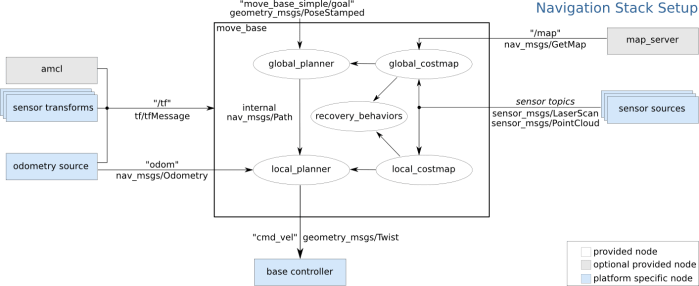
Navigation Stack Setup for Phoebe

rosorg-logo1Section 1 “Robot Setup” of this ROS Navigation tutorial page confirmed Phoebe met all the basic requirements for the standard ROS navigation stack. Section 2 “Navigation Stack Setup” is where I need to tell that navigation stack how to run on Phoebe.

I had already created a ROS package for Phoebe earlier to track all of my necessary support files, so getting navigation up and running is a matter of creating a new launch file in my existing directory for launch files. To date all of my ROS node configuration has been done in the launch file, but ROS navigation requires additional configuration files in YAML format.

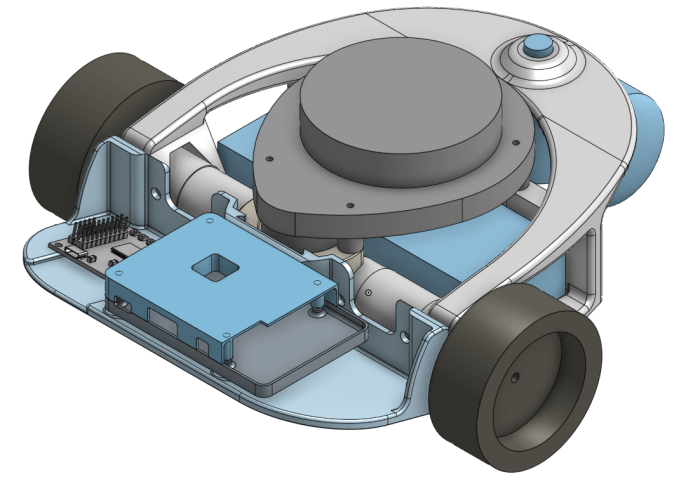
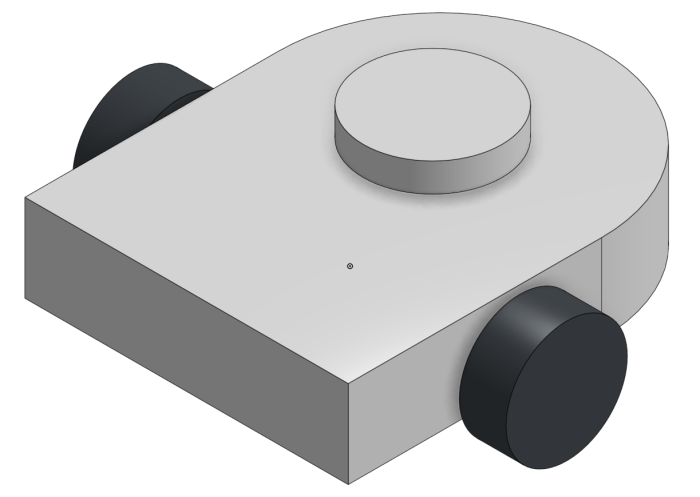
First up in the tutorial were the configuration values common for both local and global costmap. This is where I saw the robot footprint definition, a little sad it’s not pulled from the URDF I just put together. Since Phoebe’s footprint is somewhat close to a circle, I went with the robot_radius option instead of declaring a footpring with an array of [x,y] coordinates. The inflation_radius parameter sounds like an interesting one to experiment with later pending Phoebe performance. The observation_sources parameter is interesting – it implies the navigation stack can utilize multiple sources simultaneously. I want to come back later and see if it can use a Kinect sensor for navigation. For now, Phoebe has just a LIDAR so that’s how I configured it.

For global costmap parameters, the tutorial values look equally applicable to Phoebe so I copied them as-is. For the local costmap, I reduced the width and height of the costmap window, because Phoebe doesn’t travel fast enough to need to look at 6 meters of surroundings, and I hoped reducing to 2 meters would reduce computation workload.

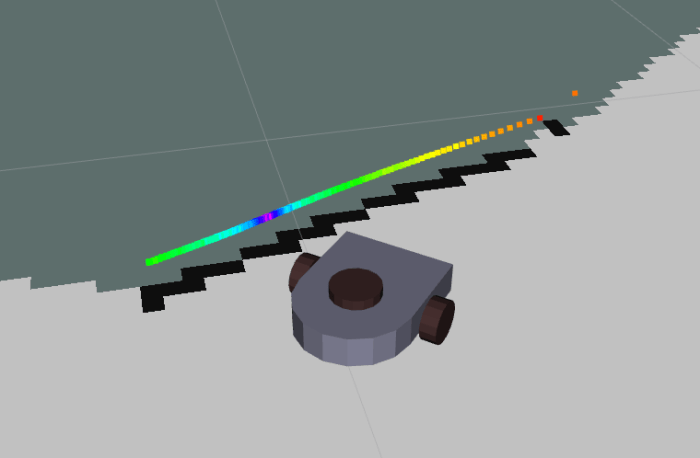
For base local planner parameters, I reduced maximum velocity until I have confidence Phoebe isn’t going to get into trouble speeding. The key modification here from tutorial values is changing holonomic_robot from true to false. Phoebe is a differential drive robot and can’t strafe sideways as a true holonomic robot can.

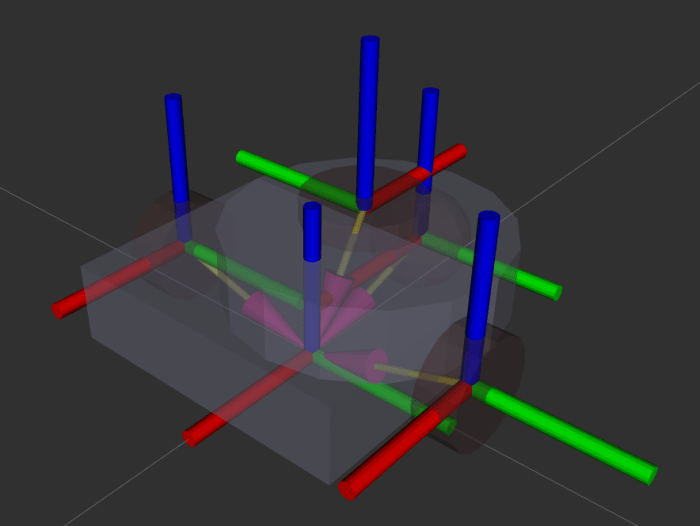
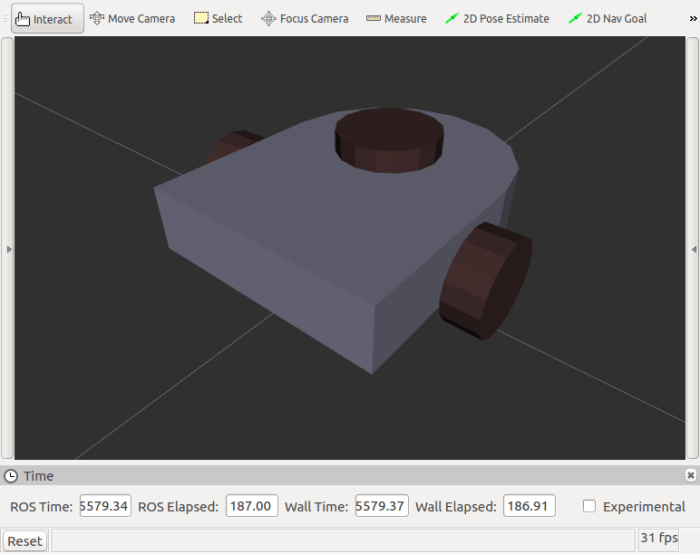
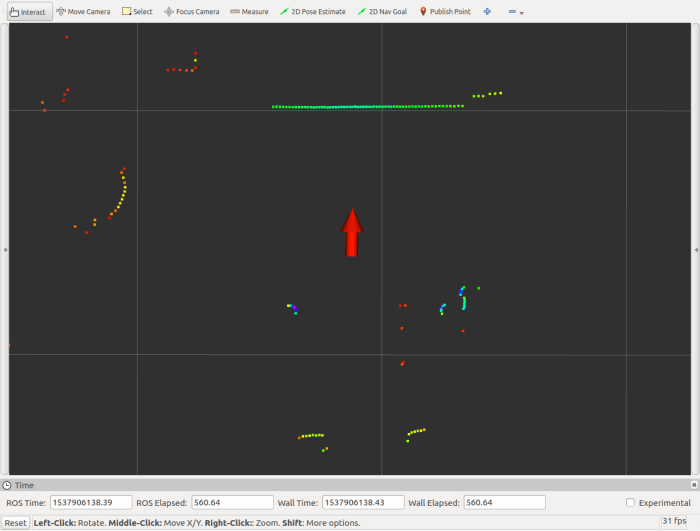
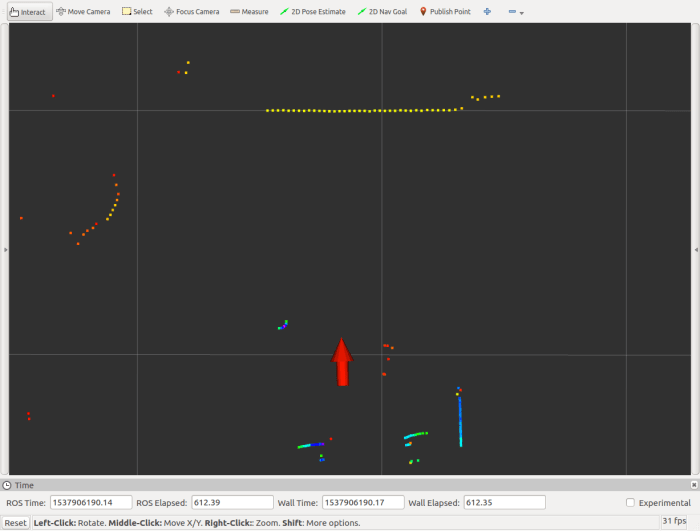
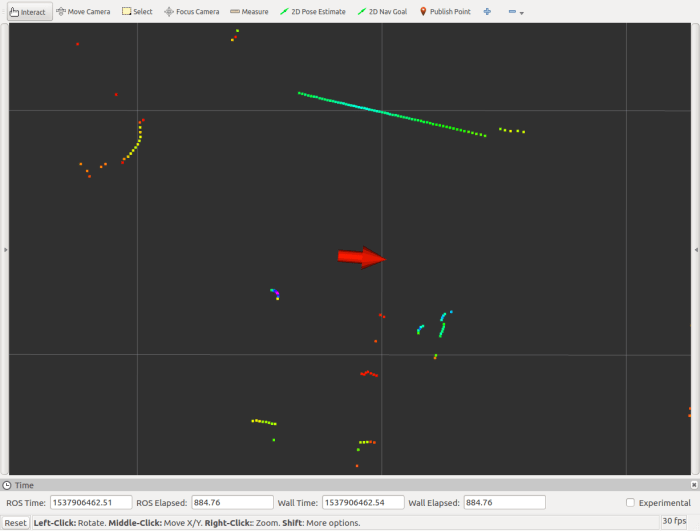
The final piece of section 2 is AMCL configuration. Earlier I’ve tried running AMCL on Phoebe without specifying any parameters (use defaults for everything) and it seemed to run without error messages, but I don’t yet have the experience to tell what good AMCL behavior is versus bad. Reading this tutorial, I see the AMCL package has pre-configured launch files. The tutorial called up amcl_omni.launch. Since Phoebe is a differential drive robot, I should use amcl_diff.launch instead. The RViz plot looks different than when I ran AMCL with all default parameters, but again, I don’t yet have the experience to tell if it’s an improvement or not. Let’s see how this runs before modifying parameters.

(Cross-posted to Hackaday.io.)

Checking If Phoebe Meets ROS Navigation Requirements

Now that basic coordinate transform frames have been configured with help of URDF and robot state publisher, I moved on to the next document: robot setup page. This one is actually listed slightly out of order list item on ROS navigation page, third behind the Basic Navigation Tuning Guide. I had started reading the “Tuning Guide” and saw that, in that introduction, the tuning guide assumes people have read the robot setup page. It’s not clear why they are out of order, but clearly robot setup needs to come first.

Right up front in Section 1 “Robot Setup” was a very helpful diagram labelled “Navigation Stack Setup” showing major building blocks for an autonomously navigating ROS robot. Even better, these blocks are color-coded as to their source. White blocks are part of the ROS navigation stack, gray parts are optional components outside of that stack, and blue indicates robot-specific code to interface with navigation stack.

overview_tf
Navigation Stack Setup diagram from ROS documentation

This gives me a convenient checklist to make sure Phoebe has everything necessary for ROS navigation. Clockwise from the right, they are:

  • Sensor source – check! Phoebe has a Neato LIDAR publishing laser scan sensor messages.
  • Base controller – check! Phoebe has a Roboclaw ROS node executing movement commands.
  • Odometry source – check! This is also provided by the Roboclaw ROS node reading from encoders.
  • Sensor transforms – check! This is what we just updated, from a hard-coded published transform to one published by robot state publisher based on information in Phoebe’s URDF.

That was the easy part. Section 2 was more opaque to this ROS beginner. It gave an overview of the configuration necessary for a robot to run navigation, but the overview assumes a level of ROS knowledge that’s at the limit of what I actually have in my head right now. It’ll probably take a few rounds of trial and error before I get everything up and running.

(Cross-posted to Hackaday.io)

Phoebe Digital Avatar in RViz

Now that Phoebe URDF has been figured out, it has been added to RViz visualization of Phoebe during GMapping runs. Before this point, Phoebe’s position and orientation (called a ‘pose‘ in ROS) is represented by a red arrow on the map. It’s been sufficient to get us this far, but a generic arrow is not enough for proper navigation because it doesn’t represent the space occupied by Phoebe. Now, with the URDF, the volume of space occupied by Phoebe is also visually represented on the map.

This is important for a human operator to gauge whether Phoebe can fit in certain spaces. While I was driving Phoebe around manually, it was a guessing game whether the red arrow will fit through a gap. Now with Phoebe’s digital avatar in the map, it’s a lot easier to gauge clearance.

I’m not sure if the ROS navigation stack will use Phoebe’s URDF in the same way. The primary reason the navigation tutorial pointed me to URDF is to get Phoebe’s transforms published properly in the tf tree using the robot state publisher tool. It’s pretty clear robot footprint information will be important for robot navigation for the same reason it was useful to human operation, I just don’t know if it’s the URDF doing that work or if I’ll end up defining robot footprint some other way. (UPDATE: I’ve since learned that, for the purposes of ROS navigation, robot footprint is defined some other way.)

In the meantime, here’s Phoebe by my favorite door to use for distance reference and calibration.

Phoebe By Door Posing Like URDF

And here’s the RViz plot, showing a digital representation of Phoebe by the door, showing the following:

  • LIDAR data in the form of a line of rainbow colored dots, drawn at the height of the Neato LIDAR unit. Each dot represents a LIDAR reading, with color representing the intensity of each return signal.
  • Black blocks on the occupancy map, representing space occupied by the door. Drawn at Z height of zero representing ground.
  • Light gray on the occupancy map representing unoccupied space.
  • Dark gray on the occupancy map representing unexplored space.

Phoebe By Door

(Cross-posted to Hackaday.io)

Phoebe URDF: Fixing Functional Problems

Once I had a decent looking URDF for Phoebe up and running, I added it into the Phoebe launch files and started working on the problems exposed by putting it to work.

The first problems were the drive wheels. Visually, they were stuck at the origin and didn’t move with the rest of the robot. Looking through error messages I realized ROS had expected me to read wheel encoder values and publish them as joint state. Since I hadn’t done so, this meant the wheels (attached with “continuous” joint) didn’t know their location. Until I get around to processing wheel encoder values, the joint type was changed to “fixed” to attach them to the chassis.

Looking at the model from multiple angles, I realized I forgot the caster wheel. Since it’s not driven, it is represented as a simple sphere and also attached via a fixed joint.

That’s enough to start driving around as a single unit, but the robot movement in RViz was reversed front/back with LIDAR data plot. This was caused by the fact I forgot to tell ROS the LIDAR is pointed backwards on the robot. Once I had done so, the 180 degree yaw is visible on the object axis visualization: The LIDAR’s X-axis (red cylinder) is pointing backwards instead of forwards like all the other axis.

Phoebe RViz Axes Arrows No Name

The final set of changes might be more cosmetic than functional. When reading about differential drive robots in ROS, it was brought up several times that the robot’s X/Y origin base_link need to be lined up with the pivoting axis of the robot. However, it wasn’t clear where the Z axis is supposed to be. Perhaps this is different for each ROS mapping module? The algorithm hector_slam defined several frames but they don’t appear to be supported by gmapping.

I first defined Phoebe origin as the center point between its two drive wheel axles. When rendered in RViz, this means the Z plane intersects the middle of the robot. It seems to work well, but the visualization looks a bit odd. Intuitively I want the Z plane to represent the ground, so I decided to drop the robot origin to ground level. In the object visualization, this is visible as the purple arrow heads all pointing at a center point below the robot. If I learn this was a bad move later, I’ll have to change it back.

All these changes combined gave me a Phoebe URDF with minimal representation in RViz visualization of Phoebe behavior.

(Cross-posted to Hackaday.io)

Describe Phoebe For ROS Using URDF

Now that I’ve decided to bring up the ROS navigation stack for Phoebe, where do I start? Well, the ROS Wiki page for the subject is always a good place to start, as they tend to have a tutorial for the subject. ROS navigation is no exception.

The first recommended page is actually a familiar sight – the brief overview on tf was required reading back when I first assembled the chassis. At the time, I could get away with a very simple static publisher, because I just had to tell ROS how and where my Neato LIDAR is mounted on my robot chassis. But now I guess I need to advanced to the next step and publish robot state. And this means describing Phoebe in more detail for ROS using a XML syntax called URDF (Unified Robot Descriptor Format).

So in order to bring up ROS navigation on Phoebe, the navigation wiki page has pointed me to robot state publisher and also the ROS URDF Tutorial. To learn one thing I had to learn another, the typical bootstrap process when learning something new.

For the purposes of robot physics simulation, the robot should be described using very basic geometry: a combination of rectangular solids, cylinders, and spheres. This keeps the computation workload for collision detection simple. While the visual representation can be more complex than the collision detection representation, it doesn’t have to be. So for this first draft, I’ll just do a super simple Phoebe for visual representation, suitable for use in collision calculations if I get into that later.

I started with Phoebe’s Onshape CAD file.

Phoebe CAD Full

Taking the critical dimensions, I created a simplified version in Onshape CAD using just rectangular boxes and cylinders. This exercise makes it a fairly straightforward exercise to translate into URDF.

Phoebe CAD Simplified

By measuring the dimensions in CAD, I could declare a few primitives with URDF and see what it looks like in RViz for comparison against CAD. Once the visual appearance is roughly correct, it’s time to tune the details and make sure they work for ROS functional purposes.

Phoebe RViz Simplified

(Cross-posted to Hackaday.io)

Next Phoebe Project Goal: ROS Navigation

rosorg-logo1When I started working on my own TurtleBot variant (before I even decided to call it Phoebe) my intention was to build a hardware platform to get first hand experience with ROS fundamentals. Phoebe’s Hackaday.io project page subtitle declared itself as a ROS robot for <$250 capable of SLAM. Now that Phoebe can map surroundings using standard ROS SLAM library ‘gmapping‘, that goal has been satisfied. What’s next?

One disappointment I found with existing ROS SLAM libraries is that the tutorials I’ve seen (such as this and this) expect a human to drive the robot during mapping. I had incorrectly assumed the robot would autonomously exploring its space, but “simultaneous location and mapping” only promises location and mapping – nothing about deciding which areas to map, and how to go about it. That is left to the human operator.

When I played with SLAM code earlier, I decided against driving the robot manually and instead invoked an existing module that takes a random walk through available space. A search on ROS Answers web site for something more sophisticated than a random walk resulted in multiple pointers to the explore module, but that code hasn’t been maintained since ROS “groovy” four versions ago. So one path forward is to take up the challenge of either update explore or write my own explorer.

That might be interesting, but once a map is built, what do we do with it? The standard ROS answer is the robot navigation stack. This collection of modules is what gives a ROS robot the ability to plan a path through a map, watch its progress through that plan, and update the plan in reaction to unexpected elements in the environment.

At the moment I believe it would be best to learn about the standard navigation stack and getting that up and running on Phoebe. I might return to the map exploration problem later, and if so, seeing how map data is used for navigation will give me better insights into what would make a better map explorer.

(Cross-posted to Hackaday.io)

Phoebe Accessory: HDMI Plug

In most ROS demonstrations, the robots are running through a pristine laboratory environment. Phoebe is built to roam my home, which is neither a laboratory or pristine. This became a problem when Phoebe ran across some dust bunnies and picked them up with its leading edge.

When choosing an orientation for Raspberry Pi 3 on Phoebe’s electronics tray, I chose to make the HDMI port accessible so I could connect a monitor as necessary. This resulted in that port facing forward along with the micro-USB power port and the headphone jack. All three of these ports were plugged up with debris when Phoebe explored some paths less well-traveled.

After I cleaned up the mess, all three ports appeared to work, but I was worried about Phoebe encountering some less fluffy obstacles. The audio jack was not a high priority as Raspberry Pi default audio is notoriously noisy and I haven’t needed it. The power jack could be easily bypassed by sending power via the GIPO pins (as I’m doing right now). That leaves the HDMI port, which can be quite inconvenient if damaged.  If I need a screen on a Pi with damaged HDMI port, I’d need to buy or borrow a screen that goes into the alternate DSI port like the official Raspberry Pi touchscreen.

Fortunately, there are little plastic plugs that come with certain HDMI peripherals for protection during shipping. In my case, I had a small red HDMI plug that came with my MSI video card. I installed it on Phoebe’s Raspberry Pi to protect the HDMI port against future debris encounters. Now Phoebe has a red nose. If it should glow I might have to rename my robot to Rudolph the Red Nosed Robot.

But it doesn’t glow, so Phoebe won’t get a name change.

Phoebe HDMI Plug

(Cross-posted to Hackaday.io)

Phoebe Accessory: Battery Voltage Monitor

And now, a few notes on some optional accessories. These aren’t required for anyone building their own Phoebe, but are nice to have.

The first item is a battery voltage meter and alarm. While Phoebe can monitor battery voltage in software via Roboclaw API, I also wanted an always-available physical readout of battery voltage. On Sawppy I thought I just needed to show the battery’s output voltage, but the number is only good if I could read it. During Sawppy’s all-day outing at JPL, California sunlight was too bright to read the number and I couldn’t tell when my battery dropped below recommended level for lithium chemistry batteries.

Searching for a better solution, I found these battery voltage alarms (*). Not only do they display voltage, when the level gets too low they also sound a buzzer. Judging by its product description, these were designed for remote-control aircraft where it’s not convenient to read a small number up in the air.

The downside is that the alarm is designed to be audible while up in the air and buried inside a fuselage. When it is on the ground and right in front of my face, it is a piercing shriek. Which isn’t so bad if it only occurs during low battery… but it also sounds a test beep when I first plug it in. It is loud. Very loud. To save my eardrums, the alarm buzzer has been muffled with some cotton pulled from a cotton swab. It’s still loud, but no longer gives me a headache afterwards.

I’ve also soldered a JST-XH connector onto the unpolarized input pins to fit my battery’s balance charging plug. Having a polarized connector helps make sure I don’t plug the battery in backwards. Those exposed pins are also a short-circuit risk, which I crudely mitigated by wrapping a layer of servo tape around them. Finally servo tape is used to secure the alarm to Phoebe’s backbone.

Now I can drive Phoebe around the house, even out of sight, confident that if I ever run the battery too low I’ll be notified with an alarm.

(Cross-posted to Hackaday.io)


(*) Disclosure: As an Amazon Associate I earn from qualifying purchases.

Animated GIF For When A Screenshot Is Not Enough

Trying to write up yesterday’s blog post posed a challenge. I typically write up a blog post with one or more images to illustrate the topic of the day. Two days ago I talked about lining up Phoebe’s orientation before and after a turn. For that topic, a screenshot was appropriate illustration. But yesterday’s topic is about Phoebe’s RViz plot of LIDAR data moving strangely. How do I convey “moving strangely” in a picture?

After thinking over the problem for a while, I decided that I can’t do it with a static image. What I need is a short video. This has happened before on this blog, but doing a full YouTube video clip seems excessive for this particular application. I only need a few frames. An animated GIF seems like just the thing.

I went online looking for ways to do this, and there were an overwhelming number of answers. Since my project is relatively simple, I didn’t want to spend a lot of time learning a new powerful tool that can do far more than what I need. When a tool is described as simple and straightforward, that gets my attention.

So for this project I went with Kazam that was described on this page as a “lightweight screen recorder for Ubuntu”. Good enough for me. The only hiccup in my learning curve was in the start/stop sequence. Recording can be started by clicking “Capture” button from the application dialog box, but there was no counterpart for stopping. Recording had to be stopped from the icon in the upper right corner of the screen.

Everything else was straightforward and soon I had a MP4 video file of RViz displaying LIDAR movement. Then it was off to this particular Ubuntu answer page to turn MP4 into an animated GIF using command line tools ffmpeg and convert. However, that results in a rather large multi-megabyte GIF file, far larger than the MP4 source at a little over 100 kilobytes! Fortunately these instructions also pointed to the convert option -layers optimize which reduced the size drastically. At over 200 kilobytes, it was still double the size of the captured MP4, but at least it’s well under a megabyte. And more importantly, it is allowed for embedding at my blog hosting subscription tier.

This RViz plot has only simple colors and lines, ideally suited for animated GIF so it could have been even smaller. I suspect a tool dedicated to representing simple geometries on screen could produce a more compact animated GIF. If I ever need to do this on a regular basis, I’ll spend more time to find a better solution. But for today Kazam + ffmpeg + convert was good enough.

Robot Disorientation Traced To Timing Mismatch

Once the Roboclaw ROS Node‘s wheel parameters were updated to match the new faster motors, Phoebe went on a mapping run. And the results were terrible! This is not a complete surprise. Based on previous experimentation with this LIDAR module, I’ve seen its output data distorted by motion. It doesn’t take a lot of motion – even a normal human walking pace is enough to cause visible distortion. So now that Phoebe’s motors are ten times faster than before, that extra speed also adds extra distortion.

While this is a problem, it might not be the only problem behind the poor map. I decided to dig into an anomaly I noticed while using RViz to calibrate wheel data against LIDAR data: there’s some movement that can’t be entirely explained by a LIDAR spinning at 240 RPM.

The idea behind this odometry vs. LIDAR plot on RViz is to see if wheel odometry data agrees with LIDAR data. My favorite calibration surface is a door – it is a nice flat surface for LIDAR signal return, and I could swing the door at various angles for testing. In theory, when everything lines up, movement in the calculated odometry would match LIDAR observed behavior, and everything that is static in the real world (like the door) would be static in the plot as well.

In order to tune the base_width parameter, I looked at the position of the door before turning, and position after turning. Adjusting base_width until they line up, indicating odometry matches LIDAR. But during the turn, the door moved relative to the robot before finishing at the expected position.

When Phoebe started turning (represented by red arrow) the door jumped out of position. After Phoebe stopped turning, the door snapped back to position. This means non-moving objects appear to the robot as moving objects, which would confuse any mapping algorithm.

Odom LIDAR Mismatch No Hack

I chased down a few dead ends before realizing the problem is a timing issue: the timestamp on the LIDAR data messages don’t line up with the timestamp on odometry messages. At the moment I don’t have enough data to tell who is at fault, the LIDAR node or the Roboclaw node, just that there is a time difference. Experimentation indicated the timing error is roughly on the order of 100 milliseconds.

Continuing the experiment, I hard-coded a 100ms timestamp delta. This is only a hack which does not address the underlying problem. With this modification, the door still moves around but at least it doesn’t jump out of place as much.

Odom LIDAR Mismatch 100ms hack

This timing error went unnoticed when Phoebe was crawling extremely slowly. But at Phoebe’s higher speed this timing error could not longer be ignored. Ideally all of the objects on the RViz plot would stay still, but we clearly see nonuniform distortion during motion. There may be room for further improvement, but I don’t expect I’ll ever get to ideal performance with such an inexpensive LIDAR unit. Phoebe may end up just having to go slowly while mapping.

(Cross-posted to Hackaday.io)

Using RViz to Validate Motor Movement Against LIDAR Data

The Roboclaw ROS node is responsible for calculating odometry information based on encoder values read from each wheel. In order to translate them into standard ROS units, it needs two parameters:

  • ticks_per_meter : To calculate physical distance traversed by each wheel, the code needs to know how many encoder counts it takes for the wheels to travel one meter.
  • base_width : To calculate how much the robot has turned, the code needs to know how far apart the two drive wheels are placed.

Both of these values needed updating after upgrading Phoebe to the second chassis. I got impatient with the slow speed of the first draft, so the motor gearboxes were changed out with ones that deliver less torque and precision but much faster top speed. This change of gearing would need a new ticks_per_meter value. And the second chassis is slightly wider than the first, which obviously changes the base_width value. Both of these could be calculated on paper, but that is only a starting point. Real world is always a little different from the theoretical and needs a little adjustment.

The easiest place to start is ticks_per_meter. Phoebe is placed on a flat surface, next to a ruler, and commanded to drive straight forward for a short distance. During this activity, the odometry data is monitored with rostopic echo /odom to see how far Phoebe thinks it has actually gone. If the ruler said Phoebe didn’t go as far as it thought it did, increase ticks_per_meter. If Phoebe overshot, reduce that value.

Once wheel travel was verified with a ruler, LIDAR is added to the picture. RViz is commanded to plot odometry data and LIDAR data together, and Phoebe is placed facing a door serving as a large flat surface for reference. The red arrow represents where Phoebe thinks it is, facing the horizontal line representing its LIDAR’s view of the door.

Phoebe Door Test 1 Start

Then Phoebe was commanded to move backwards 0.5m. If odometry data agrees with LIDAR data, the movement away from door and the door’s distance from robot would match, canceling each other out so the line representing the door would not move on the RViz plot. It looks like the ruler calibration worked out well, as we’re only a tiny bit off.

Phoebe Door Test 2 Back 0.5m.png

Once distance was verified, we move on to rotation. Command Phoebe to make a 90 degree turn clockwise and see if LIDAR plot agrees. Again, ideally the turn calculated from odometry would agree with the LIDAR plot, leaving the door in roughly the same place on the RViz plot. Ideally.

Phoebe Door Test 3 90 Deg Right Bad

In this case, however, the door shows a minor clockwise rotation. This change of position in LIDAR data indicates Phoebe didn’t turn as far as it thought it did. To adjust parameters so Phoebe’s calculations better align with actual motion, we can increase the base_width parameter. And if the door had rotated the other way (Phoebe turned further than it thought it did) the parameter should be decreased.

(Cross-posted to Hackaday.io)