Window Shopping SerialTool

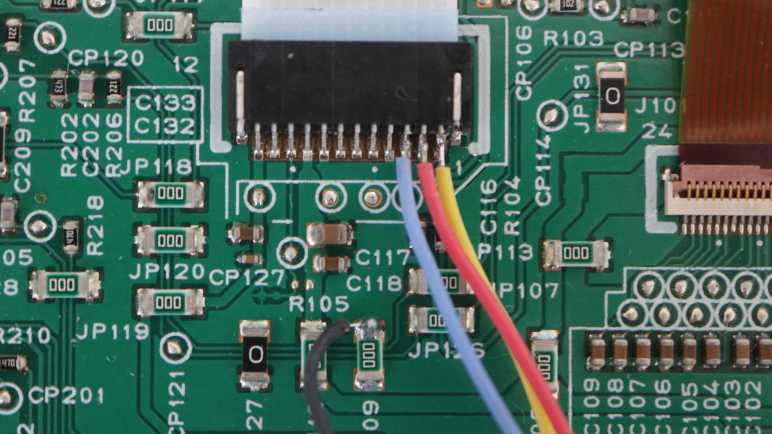
I seek tools to help me understand the communication between the main board and control panel of a Canon Pixma MX340 multi-function inkjet. The data is asynchronous serial 250000-8-E-1 which is something a Bus Pirate can interface with, but only as one end of the communication with a transmit/receive pair. I want to listening in on communication between two existing endpoints, which meant I would need to set up something with two receive and no transmit wires. Continuing my search, I found SerialTool which is very close to what I want for this purpose, but not exactly.

SerialTool’s web site claims it came from engineers for embedded devices, which puts it in the right ballpark audience for this task. Like WireShark, it is an application that can run on Windows, MacOS, or Linux PCs. The hardware side of SerialTool is any serial port device recognized by the operating system of choice. In my case, it will be USB to serial adapters like the trusty unit (*) I’ve been using for many projects.

Of course, a standard USB to serial adapter has the same limitation as a Bus Pirate: a single transmit wire and a single receive wire. For two receive wires, I would need to use two adapters. Which gets into one of the headline features of SerialTool: its ability to work across multiple serial devices simultaneously. Two ports are possible on the free version, the Professional edition raises the limit to 4 simultaneous serial ports.

SerialTool’s “Auto Answer” feature looks interesting. It is a mechanism to quickly set up “if (receive thing) then (send answer)” which is helpful to stub out one placeholder end of a serial communication link. In my current example, I could potentially set it up to a dummy control panel and acknowledge “0x20” to every command sent by the main board.

But that’s not what I need right now. I want something to examine incoming data for expected patterns and alert me if something unexpected comes through. I thought SerialTool’s “Trigger Alarm” feature was promising, but as I read the document I realized it compares incoming data and an alert fires if a match is found. This is the opposite of what I wanted: an alert in case of no match.

One of the advertised uses for SerialTool is for testing and verification of embedded devices, so I was curious my wish is absent. For testing and verification purposes, I thought it would be natural to have a mechanism to raise an alert in case of unexpected anomalous data. But if SerialTool could do such a thing, I failed to find it.

I found references to a few other pieces of software that appear to be competitors to SerialTool, but they all target professional embedded systems engineers and not hobbyists. Or more specifically, their price tags say “business expense” and there is no free version. Whether they do what I want or not is irrelevant if I can’t justify that kind of expense.

Oh well, I guess I’m going to create my own tool.


Header image: screen shot from SerialTool web site.

This teardown ran far longer than I originally thought it would. Click here to rewind back to where this adventure started.

(*) Disclosure: As an Amazon Associate I earn from qualifying purchases.

Window Shopping Bus Pirate

I’m looking for tools to help me analyze the communication between the main board and control panel of a Canon Pixma MX340 multi-function inkjet. The data is asynchronous serial 250000-8-E-1 so Wireshark was the wrong tool for the job. Wireshark can perform much of the data manipulation tasks I wished for, but it works for network packets and not general serial data.

Focusing my search on serial data tools for an electronics hobbyist, I came across several mentions of something called Bus Pirate. This is something I had been aware of. In fact, I bought one several years ago upon recommendation by another hobbyist, but I have yet to put it to work for any of my own projects.

The core usage scenario for a Bus Pirate is programmatic access to some basic common electronic interfaces like SPI, I2C, and my current focus: asynchronous serial. The idea is that we can experiment with these interfaces using interactive commands, versus writing a microcontroller program that we have to compile and upload to flash on every change. That’s gives us an immediate turnaround time versus 20-30 seconds, time that will really add up when performing rapid iteration. For example, in the tentative early stages of bootstrapping a new piece of hardware.

In addition to the data interfaces, Bus Pirate also provide control over some interface-adjacent tools. The one that caught my eye is the ability to provide 5V and 3.3V DC power, and to turn them on/off on command. Again, this is very useful in early stages of working with new hardware, because if we mess up commands and accidentally put the hardware in a bad state, we can quickly turn it off and back on again with a command instead of unplugging anything and plugging it back in.

In hindsight, a Bus Pirate would have been really useful when I was experimenting with salvaged I2C LCD screens, allowing faster experimentation. At the time, I had forgotten I had a Bus Pirate gathering dust on the shelf. I don’t think a Bus Pirate would have been useful for a car audio face plate, though. Due to the fact they used Sanyo’s CCB protocol and that’s not something Bus Pirate understands.

I think Bus Pirate will be useful soon, because after I take this MX340 completely apart I want to try repurposing the control panel. I should be able to impersonate the main board by using my own hardware to play back the command sequences I’ve captured and analyzed. Getting that up and running should be a perfect opportunity to finally use my Bus Pirate for its designed purpose.

But a Bus Pirate won’t be helpful for me right now, because I want to listen in on existing communication and not interfere. Which means I want two UART receive wires, and the Bus Pirate only has a single UART with a single transmit wire and a single receive wire. The type of data filtering I want to perform isn’t part of core Bus Pirate functionality, either. As Bus Pirate itself has long been discontinued, I quickly skimmed over the spec sheet for its successors GoodFET (also discontinued) and GreatFET One (currently active product), but they don’t seem to have added the kind of features I want right now. My search continues.


This teardown ran far longer than I originally thought it would. Click here to rewind back to where this adventure started.

Window Shopping Wireshark

I’ve taken apart a Canon Pixma MX340 multi-function inkjet and I want to reverse-engineer the communication data between its main board and its control panel. After making an attempt at articulating characteristics of a tool I want, I went online to see if such a thing existed.

When searching with keywords like “reverse-engineering”, “communication protocol analysis”, “data filtering” and such, one name keeps coming up: Wireshark. It is a very powerful piece of analysis software and something on my to-do list as a tool I want to add to my toolbox. It certainly has some capabilities I want. One example is being able to annotate raw data to give it context. If I’ve determined a particular two-byte command 0x04 0x75 means “put the screen to sleep”, that translation can be automated so I don’t have to recognize it and transform in my head. Wireshark also has extensive filtering capability, so I could exclude common high traffic data and focus on the interesting unique parts. Though there seems to be a bit of a caveat: Wireshark has two separate filtering mechanisms. A less powerful mechanism that runs on live data during capture, and an entirely separate and more powerful filtering mechanism for analyzing data after capture. For the type of filtering I wish for, Wireshark might only be capable of post-processing captured data.

Regardless of possible limitations Wireshark is not the right tool for my current project, because it is designed to analyze network traffic. Wired Ethernet, Wi-Fi, and so on. I tried to exclude Wireshark from my search by requiring “+serial” but Wireshark still comes up. It took some reading through Wireshark documentation to figure out why. It turns out Wireshark supports capturing and analyzing network traffic transmitted over asynchronous serial via point-to-point protocol (PPP) or its predecessor serial line internet protocol (SLIP). Neither of which is applicable to my MX340 project, but search engines don’t know enough to understand that distinction. Oh well. I adjusted my query to explicitly exclude Wireshark from my results in order to see what else is out there.


As an aside, I was amused by this snippet:

Can you help me fill out this compliance form so that I can use Wireshark?

Please contact the Wireshark Foundation and they will be able to help you for a nominal fee.

Can you sign this legal agreement so that I can use Wireshark?

Please contact the Wireshark Foundation and they will be able to help you for a somewhat less nominal fee.

— from Wireshark FAQ

This teardown ran far longer than I originally thought it would. Click here to rewind back to where this adventure started.

Canon Pixma MX340 Control Panel Data Filter Wish List

At this point in my adventures with a retired Canon Pixma MX340 multi-function inkjet, I have a rudimentary understanding of the asynchronous serial communication between its main board and its control panel. To help fill in remaining gaps in my knowledge, I want a tool that can recognize the patterns I’ve identified and alert me whenever it sees something outside of those patterns.

At a hardware level, I want this mechanism to listen in on data transmitted in both directions: from main board to control panel, and from control panel to main board. This is the default operating mode for an oscilloscope and a logic analyzer, which I’ve used to date. But if I want to build something with commodity hardware I will probably use hardware UARTs. They have provision to connect in a RX/TX pair of wires. If I want to use standard UART peripheral to listen to both directions, I will need two UART and connect their RX wires to each of two directions. Their TX wires would be left unconnected as I will not inject data into either path.

At a software level, I want to describe the patterns I’ve observed so far on each channel. For the control panel to main board wire, this means watching the button matrix report every 9.2ms. It means looking for 0x20 sent as acknowledgement to main board commands. If anything else comes up, it will need to raise an alert in some way. Ideally it can dump out the unexpected data as well, but if not I can still use the logic analyzer to capture and analyze those events.

Similarly, the other wire carrying signals from main board to control panel will need to recognize the two-byte command sequences I’ve recorded to date, plus the 196-byte bulk transfers for LCD screen update. I want be alerted in case of command sequences I haven’t seen yet. Or if a bulk transfer isn’t 196 bytes or otherwise not fitting in the LCD screen update pattern.

The capability I wish for here doesn’t feel particularly exotic. While my reverse-engineering project might not be a mainstream scenario, such capabilities would be useful for verification and testing. Useful for ensuring devices on either end of an asynchronous serial link is behaving according to spec. The challenge is whether I can figure out the right keywords to find such a thing.


This teardown ran far longer than I originally thought it would. Click here to rewind back to where this adventure started.

Canon Pixma MX340 Control Panel Data Communication: What Else Is There?

I’ve been looking at communication between control panel and main board of a Canon Pixma MX340 multi-function inkjet. Comparing electronic traffic against user visible behavior, I associated a particular pattern with a LCD screen update. Turns out it transmitted the entire screen buffer, something I was able to visualize thanks to Microsoft Excel.

With Excel’s help counting and demystifying the screen update payload, I have a pretty good grasp on the shape of the data I captured in six basic scenarios:

  • The control panel (more specifically the NEC K13988 chip on board) transmits a report on button matrix data every 9.2ms. Upon initial power-up, this is a two-byte sequence. One of the main board initialization procedure turns off the second byte, so it’s usually a single byte report.
  • Almost every command from the main board is a two-byte sequence, which is acknowledged by the K13988 with a single byte 0x20.
  • I’ve seen one exception to the two-byte pattern, a bulk transfer used for LCD screen update. It starts with a two-byte command: 0x06, then 0xC4 representing the length of 196 bytes. Once that is acknowledged with 0x20, a large transfer of the declared length occurs. The K13988 doesn’t acknowledge 0x20 until 196 bytes have been transferred. (It continues transmitting button matrix data every 9.2ms while transfer is underway.)

While I’ve deciphered a few of the two-byte commands, most of them are still mysterious and I know my list is still incomplete.

In the “known unknowns” category are two of the LEDs. The control panel has four LEDs total, and I’ve traced two of them (power and alarm) to wires under direct main board control. The other two (WiFi and “Memory/In Use”) are under control of the K13988 and I haven’t figured out which commands manage their state.

Then there are the “unknown unknowns” category: the six scenarios I captured with my logic analyzer represented the several activities transitioning from one machine state to another, but they add up to less than a minute. The machine must have other states outside of what I’ve captured.

What I’d like to do next is to set up something to monitor the serial communication stream. I want to teach it to recognize the patterns I now recognize, and alert me if something happens outside of those patterns. How might such a thing be implemented?


This teardown ran far longer than I originally thought it would. Click here to rewind back to where this adventure started.

Canon Pixma MX340 Control Panel LCD Screen Data as Excel Background Fill

I’m poking around inside a Canon Pixma MX340 multi-function inkjet, and I’ve identified a burst of data as its main board updating what’s shown on the control panel LCD screen. After exporting data captured by my logic analyzer to Microsoft Excel, it was easy to see the number of bytes in this transmission without laboriously counting it manually. Thanks, Excel!

After that success, I looked at my spreadsheet and thought I might be able to go further. This control panel uses a monochrome pixel LCD screen, and the number of bytes is roughly on par with what it would take to represent the frame buffer using one bit per pixel. Earlier I thought about writing a program to read those bytes and render them on screen, but I think I can accomplish something similar in Excel with less coding effort.

Excel has extensive charting tools and maybe there’s a way to draw a bitmap, but I’m thinking much lower tech than that. Excel can conditionally format cells based on criteria. So if I could get one cell to represent one bit then conditionally format that cell, that would turn each cell into a pixel.

The first step is to parse the logic analyzer capture data (Example: “0x44”) which Excel interpreted as text by default. I found Excel’s HEX2DEC() function, but it doesn’t want to deal with the “0x” prefix. I had to strip it out myself with RIGHT() function to pull out the rightmost two characters. After the string has been interpreted as a hexadecimal number, I could perform a bitwise AND operation with BITAND(). I repeated this eight times, one for each bit. I manually typed in the values used for each operation: 128, 64, 32, etc. knowing full well there’s very likely a more elegant way to do this. I decided manually typing in eight values is faster than researching an incrementally better way.

I copied this set of eight cells, each representing one bit in the byte, across all 1020 rows of my spreadsheet. And finally, I selected those eight columns and applied a conditional formatting rule: every cell whose value is greater than zero should be formatted as black text on black background.

That turned my eight columns into graph paper. I adjusted column width so each cell is close to a square, and started scrolling through to see the results. It looked like a reasonable bitmap, not random noise, but my brain didn’t recognize anything until I scrolled down to this section. This shape (I think it represent ink levels?) is shown on the control panel screen. I’m definitely on the right track here.

The data transmission is sent in five 196 byte chunks, so I zoomed out in Excel and snipped these five screenshots in each of those sections. Ah, I see why I didn’t immediately recognize the text: the way I did it in Excel gave me a rotated and flipped orientation. Time to pull them into a photo editor for some cropping, transforming, and aligning.

This is quite conclusive: the burst of bytes represent the LCD screen frame buffer. The raw bytes describe an image 196 pixels wide by (5 chunks * 8 pixels per byte = ) 40 pixels tall.

Looking at the actual LCD, I can see there’s only one more addressable pixel under the lowest part of “paper”, so lowest 6 pixels in the byte array are cropped. I can’t tell if it is cropped in width as well, as there’s far more room between that large “01” on the right and the right edge of the screen. Making it difficult to count accurately so that question is inconclusive for the moment. I’ll come back to this open question after I make an effort to understand what else is being transmitted on these wires.


This teardown ran far longer than I originally thought it would. Click here to rewind back to where this adventure started.

Canon Pixma MX340 Control Panel LCD Data: Back to Basics with Excel and Calc

I’m learning the internal workings of a Canon Pixma MX340 multi-function inkjet. At the moment, my attention is on data communicated between its main board and its control panel. My Saleae Logic 8 logic analyzer could pull out the raw bytes, but it doesn’t tell me what those bytes meant. The biggest question mark right now is: how to interpret the data burst I associate with a LCD screen update? I researched and decided a custom high-level analyzer (HLA) extension to Saleae Logic was not the way to go.

Since I’m a software developer by nature, I started thinking about writing code to help me decipher this data. I started thinking about wiring a microcontroller in parallel with the Saleae Logic Analyzer to pick up the asynchronous serial data. This might be the start of an interesting project down the line, but not for right now. I still don’t know enough about this data stream, so there will be a lot of trial-and-error. Uploading a new program to a microcontroller only takes 20-30 seconds, but that time adds up if I’m doing a lot of trial-ing and error-ing.

Since Saleae Logic 2 has already parsed the data, I could export that data to a file for further processing. Python should be a good choice here. A Jupyter Notebook would allow quick experimentation, with each iteration taking an eyeblink versus 20-30 seconds. Saleae Logic 2 can export the data as a CSV file, which is easily imported into Pandas for manipulation and processing in Python.

Then I realized I was overthinking the problem. If Saleae Logic 2 exports to CSV, the first thing I should do is try examining the information with the King of CSV Processing: Microsoft Excel.

I exported the capture data for LCD screen sleep and wake, because I now recognize the sleep and wake commands. Removing them leaves just the bytes for a single screen update. I scroll down to the bottom of the spreadsheet and saw there were 1020 rows. Earlier examination found a screen update is sent in five chunks. So 1020/5 = 204 bytes per chunk. Each chunk starts with a command sequence of four 2-byte commands. 204-8 = 196 bytes of data per chunk. 196 can be factored a number of different ways: 2*98, 4*49, 7*28, or 14 squared. None of those possibilities immediately jumped out at me.

Well, at least I now know my earlier guess of 256 bytes of data per chunk was wrong, and I’m very thankful I didn’t end up counting those bytes by hand. And since I have this data in Excel already, I should see how much more I can do in Excel.


This teardown ran far longer than I originally thought it would. Click here to rewind back to where this adventure started.

Window Shopping Custom Saleae High Level Analyzer Extension

I’ve been examining the internal data communication of a Canon Pixma MX340 multi-function inkjet, trying to understand the data sent between its system main board and its control panel. Out of all the data sequences I’ve captured and analyzed, the LCD “screen saver” deactivation/reactivation sequence was the easiest to understand. Others were more difficult, though I still think I’ve picked up bits and pieces. Enough to form a foundation from which to make more detailed observations.

But how would I go about such observations? There’s enough data involved that scrolling through the timeline of my Saleae Logic 8 analyzer software and decoding things manually is not practical. I need to bring additional tools into the problem. This is not an unusual task and Saleae has some provisions for users to parse and understand data captured by their logic analyzers. It is possible to write custom extensions for their Logic 2 analyzer software, plugging in our custom processing. For my specific scenario, where I want to apply context to a stream of decoded data, the type of extension is are called High-Level Analyzer (HLA) because it sits in the processing above the low-level asynchronous serial decoder.

I like the idea of writing a bit of Python code to leverage all the infrastructure that already existed in Saleae Logic 2 software. Unfortunately, as I read into their documentation, I realized it would fall short of my needs for this specific project in two important ways.

The first shortfall is a HLA can only process data from a single channel. This means a HLA can be configured to interpret bytes from main board to control board. (“This is a burst of data to update LCD screen”.) Or it can be configured on the channel sending bytes from control board back to main board. (“This 0x80 value means no buttons are currently pressed.”) But if I want to look at both channels (“This is a LCD update, followed by a single byte 0x20 as acknowledgement sent in return”) I’m out of luck. Multi-channel HLAs are a long-standing feature request that, as of this writing, is still not available.

The second shortfall is a HLA’s output is pretty much restricted to adding text annotation on the Saleae data timeline, or logging text to the developer console. I want to be able to parse the LCD screen data into a bitmap shown on screen, and I found no such facility to do so within Saleae Logic’s Extension framework.

There must exist software tools that I can leverage to perform the analysis I want, but so far I have failed to think up the correct keywords to find them online. I may have to roll my own. In the course of researching how to do so, I expect to learn the techniques and terminologies that help me find the right software making my own project superfluous. It wouldn’t be the first time I’ve done that, but at the end I would have learned what I want. That’s what matters.

And you know what else I’ve done many times in the past? Overthinking a problem! I could get started without writing any code, by using a tool I don’t usually associate with my electronics projects: Microsoft Excel.

Canon Pixma MX340 Control Panel Data Communication: LCD Deactivation

I’ve been examining the internal communication of a Canon Pixma MX340 multi-function inkjet, between its main board and its control panel. After examining what happens when the system goes into standby, I have one more trace from my initial batch of captures: a relatively simple “screen saver” mode.

Once the system is brought out of stand by and turned on, it will wait for the user to do something. If no user actions are taken, a few things happen. After just a few seconds of inactivity, it does something mechanical with the print carriage. It’s on my to-do list to better understand that later. A few minutes after that, the LCD screen goes blank. This is different from a full system standby, because the rest of the printer remains powered on. (The power LED and WiFi LEDs are still glowing, for example.) I wanted to catch this transition and see if there are any similarities to the full standby sequence.

When the LCD went blank, my logic analyzer captured a single two-byte sequence 0x04 0x75. This was very short! And very good news, because that left no ambiguity. 0x04 0x75 was indeed part of the system standby sequence, and now I have definitive proof it is a “go to sleep” command.

With the screen deactivated, I pressed a button and saw the button matrix reporting value change. Approximately 40ms after the report with new value, I saw 0x04 0xF5. 4.5ms after that, I see the LCD screen update data burst pattern. Looks like 0x04 0xF5 is a “wake up” command. Going back to review the system power-up sequence, I see 0x04 0xF5 was sent after the first LCD screen update pattern. At first I was disappointed because it contradicted the “wake up” observation, but then I remembered the first LCD screen update only lasted about 100ms before the second burst of screen data. Too short to represent data expected to be seen by the user. I had hypothesized that first update cleared the screen and this observation actually supports rather than contradicts the hypothesis: it makes sense for the system to send data to clear the screen, then wake up the screen for display. Ensuring the user is never presented with a screen filled with random uninitialized bits in memory.

Summary

  • 0x04 0x75 = stop displaying frame buffer data on screen
  • 0x04 0xF5 = begin displaying frame buffer data on screen

It’s still tentative and a tiny fraction of all the commands streaming across this channel, but I’m pretty happy I managed to decipher this much. It exceeded my expectation when I started this teardown project. I’m learning as I go! The next step will be to figure out what tools will help me gain further insight into this data, and I don’t think a custom Saleae Logic extension will help here.


This teardown ran far longer than I originally thought it would. Click here to rewind back to where this adventure started.

Canon Pixma MX340 Control Panel Data Communication: Stand By

I’m looking over data sent between control panel and main board of a Canon Pixma MX340 multi-function inkjet, and there were many mystery bytes sent during its power-up sequence. I hoped there wouldn’t be as many new things in the process of going from “On” to “Standby”.

Pressing the power button itself is absent from this logic analyzer capture file, because the power button is wired directly to the main board and not part of the button matrix reported every 9.2ms. But I could see activity in response. All transmission from the main board was acknowledged with 0x20 from the control panel, who also continued sending button matrix status every 9.2ms until the chip was put into standby.

  1. 0x0E 0xFD
  2. (4ms)
  3. LCD screen update to show the user “Ending…”
  4. (2136ms)
  5. 0x0E 0xFD
  6. (27ms)
  7. 0x04 0x75 and 0x04 0xB4.
  8. (59ms)
  9. 0x04 0x34
  10. (19ms)
  11. 0x04 0x14
  12. (19ms)
  13. 0x04 0x0E
  14. (109ms)
  15. 0x04 0xEE and 0x0E 0xDC
  16. Chip enable pin drops to ground, putting the control panel’s NEC K13988 chip to sleep.

Comparing these bytes against what I’ve seen to date, I noticed 0x0E 0xFD shows up a lot. It was among the initialization sequence when the chip is powered up from standby, and sent again after the initial LCD screen update. Here it is sent both before and after the screen update. Other than that, the only repeat I noticed is 0x04 0x34. It was the final element in the power-up initialization burst of 13 two-byte sequences. However, none of its adjacent neighbors showed up again here.

I didn’t expect to find much commonality between powering up and shutting down. If something does show up in both (0x0E 0xFD), I will tentatively infer its purpose as more general than these specific events. Other than that, I really couldn’t draw much in the way of conclusions on what these bytes mean. I expected this kind of frustration when I started this project, but it still doesn’t feel great. Fortunately, I have an easier one to help make me feel a little better: the LCD “screen saver” blank state.


This teardown ran far longer than I originally thought it would. Click here to rewind back to where this adventure started.

Canon Pixma MX340 Control Panel Data Communication: Powering On

I’m using my Saleae Logic 8 logic analyzer to examine internal communication of a Canon Pixma MX340 multi-function inkjet. When the user plugs in the power cord, there was a tiny bit of internal activity even though nothing is visible to the user. I will now compare that against the communication traffic triggered by a user press on the power button.

I had hoped to see some of the same things I saw during power cord plug-in happen during turn on as well, as that would reinforce the observation they are critical to startup. Indeed, roughly 15ms after enable pin was raised, there was a two-byte report of 0x80 0x40 again. This makes me confident we can look for that as the control panel’s first “I’m awake!” response after being enabled.

About 9.2ms later (another match from earlier observations) another 0x80 0x40 was reported. But it started just after the main board sent its own two-byte sequence 0xFE 0xDC. During plug-in I saw the main board send the same 0xFE 0xDC sequence, but in that case it didn’t start until just after the second 0x80 0x40 report from the control panel. Conclusion: Timing of 0xFE 0xDC is not dependent on control panel’s second report.

Since this 0xFE 0xDC transmission caught the control panel while it was in the middle of making its second 0x80 0x40 report, it appended its 0x20 acknowledgement immediately afterwards. Conclusion: the main board would not be confused if its 0xFE 0xDC transmission is immediately followed by a 0x40, it is still valid to send 0x20 acknowledgement afterwards.

After that exchange, there were twelve two-byte transmissions from the main board to the control panel, each acknowledged with a 0x20.

Main board to control panelControl panel acknowledgement
0x0E 0xFD0x20
0x0D 0x3F0x20
0x0C 0xE10x20
0x07 0xA10x20
0x03 0x000x20
0x01 0x000x20
0x0E 0xFC0x20
0x04 0xD50x20
0x04 0x850x20
0x04 0x030x20
0x04 0xC50x20
0x04 0x340x20

Given that the control panel just woke up, these bytes probably set configuration registers on the NEC K13988 chip. I don’t know what they all do, but the first observable effect is in the reporting data sent by the control panel every 9.2ms. Before this exchange, it would send two bytes 0x80 0x40. After this exchange, it dropped the second byte and sent just 0x80. Two such reports were sent before the next main board transmission, 0x04 0x74.

20ms later, a set of four two-byte transmissions were sent.

Main board to control panelControl panel acknowledgement
0x04 0xF40x20
0x04 0x440x20
0x04 0x810x20
0x04 0x040x20

Again I don’t know what these mean exactly, but I noticed these all started with 0x04 as their first byte. Looking at the previous sequence of twelve bytes, the final five also started with 0x04 but none of the second bytes repeated.

After that, all was quite for about 109ms, just the regular report of 0x80 from the control panel every 9.2ms. Then the main board sent one more two-byte sequence: 0x04 0x42. After that was acknowledged, I saw a pattern I recognized: a blast of bytes to update LCD screen content starting with 0x04 0x4D, 0x04 0xC8, etc. After the sequence completed, there was one more two-byte sequence I hadn’t seen before: 0x04 0xF5. Adding to the pile of unknowns: why did this screen update needed a 0x04 0x42 preamble and 0x04 0xF5 appendix?

Another 112ms later, the main board sent 0x0E 0xFD.

Another 19ms after that, there was another blast of LCD screen content. This time, there were no 0x04 0x42 preamble, nor 0x04 0xF5 suffix.

It was a relatively long wait of 669ms until the next main board transmission: 0x0E 0xFF acknowledged with 0x20. 145us later, 0x0E 0xFF was sent again and acknowledged again. More unknowns: Why did this need to be sent twice in rapid succession?

Whatever its purpose, another LCD screen update followed 65ms later. No preamble for this one, but it was followed by 0x0E 0xFF yet again.

An even longer 1695ms (1.7 seconds) later, there was another LCD screen update transmission. This had had no extra prefix or extra suffix and, after this transmission completed, I saw only the 9.2ms button matrix report for several seconds. I stopped the capture and trimmed the data to end after this transmission.

Summary

When the user presses the power button, there were a little over three seconds of activity of data sent by the main board, each acknowledged by the control panel with 0x20:

  1. (24ms)
  2. 13 two-byte sequences.
  3. (17ms)
  4. 0x04 0x74
  5. (20ms)
  6. 4 two-byte sequences.
  7. (109ms)
  8. 0x04 0x42
  9. LCD screen update
  10. 0x04 0xF5
  11. (112ms)
  12. 0x0E 0xFD
  13. (19ms)
  14. LCD screen update
  15. (669ms)
  16. 0x0E 0xFF twice
  17. (65ms)
  18. LCD screen update
  19. 0x0E 0xFF
  20. (1695ms)
  21. LCD screen update
  22. (steady state)

There are four LCD screen update sequences in this capture, but the user only sees three distinct display updates. Given there was only 115ms between the first and second update, that first update didn’t stay on screen long enough to convey any useful information for human eyes. Hypothesis: the first update is a “clear screen” sequence, something to investigate later. Right now I want to look at the mirror transition of dropping from powered-on to standby.


This teardown ran far longer than I originally thought it would. Click here to rewind back to where this adventure started.