Proxmox Cluster Node Removal

I’ve transferred the core of a computer into a 3D-printed case, reducing the volume it took up on my shelf. It’s been part of my Proxmox experimentation, getting a feel for the software by playing with different capabilities. One notable experiment was putting two machines together into a cluster, and seeing how easy and seamless it was to migrate virtual machines between them. It was really neat!

Thankfully, the Realtek network problems which forced my hand with VM migration has been resolved, and my Dell 7577 has run reliably for several months. Since it draws less power than a Mini-ITX desktop, I decided to migrated all my virtual machines back to the 7577. This will free my Mini-ITX system to be powered down for now and available for other experiments in the future. I found instructions for removing a Proxmox cluster node, but the command failed with the error message: “cluster not ready - no quorum? (500)

Major cluster operations requires quorum, defined as a majority of nodes ((number of nodes/2)+1) to be online and actively participating in cluster operations. Adding and removing cluster nodes qualify but apparently there are built-in exceptions for adding the first few nodes because by definition we have to start with a single node and build our way up. But there is no built-in exception for removal and thus I’m prevented from dropping node count back down to one.

Searching Proxmox forums, I found a workaround in thread Another “cluster not ready – no quorum? (500)” case. We can suppress quorum requirements with the command “pvecm expected 1“, then proceed with the operation that typically require quorum like removing a cluster node. Since quorum requirement exists to make sure we don’t fatally damage a Proxmox cluster, this is a very powerful hammer that needs to be wielded carefully. We have to know what we are doing, which may include requirements outside of the actual act of removing a node.

In my case, I am responsible for making sure that the removed node never gets on the network again in its current state. I unplugged the network cable from the back of the motherboard and used a Windows 10 installation USB drive to overwrite Proxmox with Windows 10. That should do it.

Canon Pixma MX340 Control Panel LCD Screen Data as Excel Background Fill

I’m poking around inside a Canon Pixma MX340 multi-function inkjet, and I’ve identified a burst of data as its main board updating what’s shown on the control panel LCD screen. After exporting data captured by my logic analyzer to Microsoft Excel, it was easy to see the number of bytes in this transmission without laboriously counting it manually. Thanks, Excel!

After that success, I looked at my spreadsheet and thought I might be able to go further. This control panel uses a monochrome pixel LCD screen, and the number of bytes is roughly on par with what it would take to represent the frame buffer using one bit per pixel. Earlier I thought about writing a program to read those bytes and render them on screen, but I think I can accomplish something similar in Excel with less coding effort.

Excel has extensive charting tools and maybe there’s a way to draw a bitmap, but I’m thinking much lower tech than that. Excel can conditionally format cells based on criteria. So if I could get one cell to represent one bit then conditionally format that cell, that would turn each cell into a pixel.

The first step is to parse the logic analyzer capture data (Example: “0x44”) which Excel interpreted as text by default. I found Excel’s HEX2DEC() function, but it doesn’t want to deal with the “0x” prefix. I had to strip it out myself with RIGHT() function to pull out the rightmost two characters. After the string has been interpreted as a hexadecimal number, I could perform a bitwise AND operation with BITAND(). I repeated this eight times, one for each bit. I manually typed in the values used for each operation: 128, 64, 32, etc. knowing full well there’s very likely a more elegant way to do this. I decided manually typing in eight values is faster than researching an incrementally better way.

I copied this set of eight cells, each representing one bit in the byte, across all 1020 rows of my spreadsheet. And finally, I selected those eight columns and applied a conditional formatting rule: every cell whose value is greater than zero should be formatted as black text on black background.

That turned my eight columns into graph paper. I adjusted column width so each cell is close to a square, and started scrolling through to see the results. It looked like a reasonable bitmap, not random noise, but my brain didn’t recognize anything until I scrolled down to this section. This shape (I think it represent ink levels?) is shown on the control panel screen. I’m definitely on the right track here.

The data transmission is sent in five 196 byte chunks, so I zoomed out in Excel and snipped these five screenshots in each of those sections. Ah, I see why I didn’t immediately recognize the text: the way I did it in Excel gave me a rotated and flipped orientation. Time to pull them into a photo editor for some cropping, transforming, and aligning.

This is quite conclusive: the burst of bytes represent the LCD screen frame buffer. The raw bytes describe an image 196 pixels wide by (5 chunks * 8 pixels per byte = ) 40 pixels tall.

Looking at the actual LCD, I can see there’s only one more addressable pixel under the lowest part of “paper”, so lowest 6 pixels in the byte array are cropped. I can’t tell if it is cropped in width as well, as there’s far more room between that large “01” on the right and the right edge of the screen. Making it difficult to count accurately so that question is inconclusive for the moment. I’ll come back to this open question after I make an effort to understand what else is being transmitted on these wires.


This teardown ran far longer than I originally thought it would. Click here to rewind back to where this adventure started.

Canon Pixma MX340 Control Panel LCD Data: Back to Basics with Excel and Calc

I’m learning the internal workings of a Canon Pixma MX340 multi-function inkjet. At the moment, my attention is on data communicated between its main board and its control panel. My Saleae Logic 8 logic analyzer could pull out the raw bytes, but it doesn’t tell me what those bytes meant. The biggest question mark right now is: how to interpret the data burst I associate with a LCD screen update? I researched and decided a custom high-level analyzer (HLA) extension to Saleae Logic was not the way to go.

Since I’m a software developer by nature, I started thinking about writing code to help me decipher this data. I started thinking about wiring a microcontroller in parallel with the Saleae Logic Analyzer to pick up the asynchronous serial data. This might be the start of an interesting project down the line, but not for right now. I still don’t know enough about this data stream, so there will be a lot of trial-and-error. Uploading a new program to a microcontroller only takes 20-30 seconds, but that time adds up if I’m doing a lot of trial-ing and error-ing.

Since Saleae Logic 2 has already parsed the data, I could export that data to a file for further processing. Python should be a good choice here. A Jupyter Notebook would allow quick experimentation, with each iteration taking an eyeblink versus 20-30 seconds. Saleae Logic 2 can export the data as a CSV file, which is easily imported into Pandas for manipulation and processing in Python.

Then I realized I was overthinking the problem. If Saleae Logic 2 exports to CSV, the first thing I should do is try examining the information with the King of CSV Processing: Microsoft Excel.

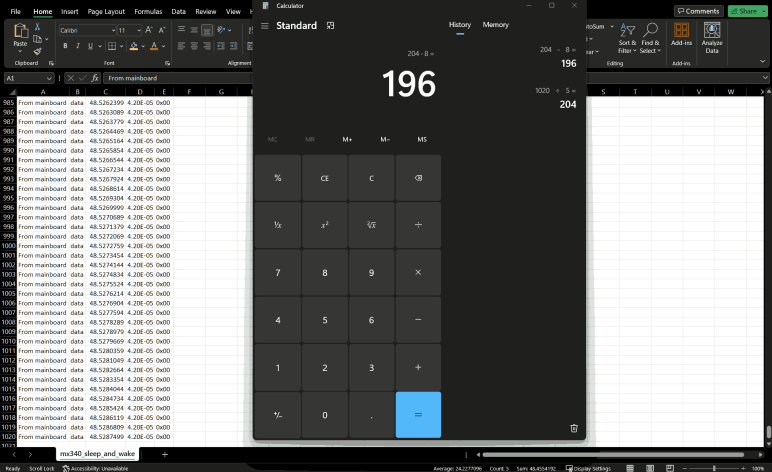
I exported the capture data for LCD screen sleep and wake, because I now recognize the sleep and wake commands. Removing them leaves just the bytes for a single screen update. I scroll down to the bottom of the spreadsheet and saw there were 1020 rows. Earlier examination found a screen update is sent in five chunks. So 1020/5 = 204 bytes per chunk. Each chunk starts with a command sequence of four 2-byte commands. 204-8 = 196 bytes of data per chunk. 196 can be factored a number of different ways: 2*98, 4*49, 7*28, or 14 squared. None of those possibilities immediately jumped out at me.

Well, at least I now know my earlier guess of 256 bytes of data per chunk was wrong, and I’m very thankful I didn’t end up counting those bytes by hand. And since I have this data in Excel already, I should see how much more I can do in Excel.


This teardown ran far longer than I originally thought it would. Click here to rewind back to where this adventure started.

Window Shopping Custom Saleae High Level Analyzer Extension

I’ve been examining the internal data communication of a Canon Pixma MX340 multi-function inkjet, trying to understand the data sent between its system main board and its control panel. Out of all the data sequences I’ve captured and analyzed, the LCD “screen saver” deactivation/reactivation sequence was the easiest to understand. Others were more difficult, though I still think I’ve picked up bits and pieces. Enough to form a foundation from which to make more detailed observations.

But how would I go about such observations? There’s enough data involved that scrolling through the timeline of my Saleae Logic 8 analyzer software and decoding things manually is not practical. I need to bring additional tools into the problem. This is not an unusual task and Saleae has some provisions for users to parse and understand data captured by their logic analyzers. It is possible to write custom extensions for their Logic 2 analyzer software, plugging in our custom processing. For my specific scenario, where I want to apply context to a stream of decoded data, the type of extension is are called High-Level Analyzer (HLA) because it sits in the processing above the low-level asynchronous serial decoder.

I like the idea of writing a bit of Python code to leverage all the infrastructure that already existed in Saleae Logic 2 software. Unfortunately, as I read into their documentation, I realized it would fall short of my needs for this specific project in two important ways.

The first shortfall is a HLA can only process data from a single channel. This means a HLA can be configured to interpret bytes from main board to control board. (“This is a burst of data to update LCD screen”.) Or it can be configured on the channel sending bytes from control board back to main board. (“This 0x80 value means no buttons are currently pressed.”) But if I want to look at both channels (“This is a LCD update, followed by a single byte 0x20 as acknowledgement sent in return”) I’m out of luck. Multi-channel HLAs are a long-standing feature request that, as of this writing, is still not available.

The second shortfall is a HLA’s output is pretty much restricted to adding text annotation on the Saleae data timeline, or logging text to the developer console. I want to be able to parse the LCD screen data into a bitmap shown on screen, and I found no such facility to do so within Saleae Logic’s Extension framework.

There must exist software tools that I can leverage to perform the analysis I want, but so far I have failed to think up the correct keywords to find them online. I may have to roll my own. In the course of researching how to do so, I expect to learn the techniques and terminologies that help me find the right software making my own project superfluous. It wouldn’t be the first time I’ve done that, but at the end I would have learned what I want. That’s what matters.

And you know what else I’ve done many times in the past? Overthinking a problem! I could get started without writing any code, by using a tool I don’t usually associate with my electronics projects: Microsoft Excel.

Realtek r8168 Driver Is Not r8169 Driver Predecessor

I have a Dell Inspiron 7577 whose onboard Realtek Ethernet hardware would randomly quit under Proxmox VE. [UPDATE: After installing Proxmox VE kernel update from 6.2.16-15-pve to 6.2.16-18-pve, this problem no longer occurs, allowing the machine to stay connected to the network.] After trying some kernel flags that didn’t help, I put in place an ugly hack to reboot the computer every time the network watchdog went off. This would at least keep the machine accessible from the network most of the time while I learn more about this problem.

In my initial research, I found some people who claimed switching to the r8168 driver kept their machines online. Judging by their names, I thought the r8168 driver was the immediate predecessor to the r8169 driver currently part of the system causing me headaches. But after reading a bit more, I’ve learned this was not the case. While both r8168 and r8169 refer to Linux drivers for Realtek Ethernet hardware, they exist in parallel reflecting two different development teams.

r8169 is an in-tree kernel driver that supports a few Ethernet adapters including R8168.

r8168 module built from source provided by Realtek.

— Excerpt from “r8168/r8169 – which one should I use?” on AskUbuntu.com:

This is a lot more complicated than “previous version”. As an in-tree kernel driver, r8169 will be updated in lock step with Linux updates largely independent of Realtek product cycle. As a vendor-provided module, r8168 will be updated to support Realtek hardware, but won’t necessarily stay in sync with Linux updates.

This explains why when someone has a new computer that doesn’t have networking under Linux, the suggestion is to try the r8168 driver: Realtek would add support for new hardware before Linux developers would get around to it. It also explains why people running r8168 driver run into problems later: they updated their Linux kernel and could no longer run their r8168 driver targeted to an earlier kernel.

Given this knowledge, I’m very skeptical running r8168 would help me. Some Proxmox users report that it’s the opposite of helpful, killing their network connection entirely. D’oh! Another interesting data point from that forum thread was the anecdotal observation that Proxmox clusters accelerate faults with the Realtek driver. This matches with my observation. Before I set up a Proxmox cluster, the network fault would occur roughly once or twice a day. After my cluster was up and running, it would occur many times a day with uptime as short as an hour and a half.

Even if switching to r8168 would help, it would only be a temporary solution. The next Linux update in this area would break the driver until Realtek catches up with an update. The best I can hope from r8168 is a data point informing an investigation of what triggers this fault condition, which seems like a lot of work for little gain. I decided against trying the r8168 driver. There are many other pieces in this puzzle.


Featured image created by Microsoft Bing Image Creator powered by DALL-E 3 with prompt “Cartoon drawing of a black laptop computer showing a crying face on screen and holding a network cable

Reboot After Network Watchdog Timer Fires

My Dell Inspiron 7577 is not happy running Proxmox VE. For reason I don’t yet understand, its onboard Ethernet would quit at unpredictable times. [UPDATE: Network connectivity stabilized after installing Proxmox VE kernel update from 6.2.16-15-pve to 6.2.16-18-pve. The hack described in this post is no longer necessary.] Running dmesg to see error messages logged on the system, I searched online and found a few Linux kernel flags to try as potential workarounds. None of them have helped keep the system online. So now I’m falling back to an ugly hack: rebooting the system after it falls offline.

My first session stayed online for 36 hours, so my first attempt at this workaround was to reboot the system once a day in the middle of the night. That wasn’t good enough because it frequently failed much sooner than 24 hours. The worst case I’ve observed so far was about 90 minutes. Unless I wanted to reboot every half hour or something ridiculous, I need to react to system state and not a timer.

In the Proxmox forum thread I read, one of the members said they wrote a script to ping Google at regular intervals and reboot the system if that should fail. I started thinking about doing the same for myself but wanted to narrow down the variables. I don’t want to my machine to reboot if there’s been a network hiccup at a Google datacenter, or my ISP, or even when I’m rebooting my router. This is a local issue and I want to focus my scope locally.

So instead of running ping I decided to base my decision off of what I’ve found so far. I don’t know why the Ethernet networking stack fails, but when it does, I know a network watchdog timer fires and logs message into the system. Reading about this system, I learned it is called a journal and can be accessed and queried using the command line tool journalctl. Reading about its options, I wrote a small shell script I named /root/watch_watchdog.sh:

#!/usr/bin/bash
if /usr/bin/journalctl --boot --grep="NETDEV WATCHDOG"
then
  /usr/sbin/reboot
fi

Every executable (bash, journalctl, and reboot) are specified with full paths because I had problems with context of bash scripts executed as cron jobs. My workaround, which I decided was also good security practice, is to fully qualify each binary file.

The --boot parameter restricts the query to the current running system boot, ignoring messages from before the most recent reboot.

The --grep="NETDEV WATCHDOG" parameter looks for the network watchdog error message. I thought to restrict it to exactly the message I saw: "kernel: NETDEV WATCHDOG: enp59s0 (r8169): transmit queue 0 timed out" but using that whole string returned no entries. Maybe the symbols (the colon? the parentheses?) caused a problem. Backing off, I found just "NETDEV" is too broad because there are other networking messages in the log. Just "WATCHDOG" is also too broad given unrelated watchdogs on the system. Using "NETDEV WATCHDOG" is fine so far, but I may need to make it more specific later if that’s still too broad.

The most important part of this is the exit code for journalctl. It would be nonzero if messages are found from the query, and zero if no entries are found. This exit code is used by the "if" statement to decide whether to reboot the system.

Once the shell script file in place and made executable with chmod +x /root/watch_watchdog.sh, I could add it to the cron jobs table by running crontab -e. I started by running this script once an hour on the top of the hour.

0 * * * * /root/watch_watchdog.sh

But then I thought: what’s the downside to running it more frequently? I couldn’t think of anything, so I expanded to running once every five minutes. (I learned the pattern syntax from Crontab guru.) If I learn a reason not to run this so often, I will reduce the frequency.

*/5 * * * * /root/watch_watchdog.sh

This ensured network outages due to Realtek Ethernet issue are no longer than five minutes in length. This is a vast improvement over what I had until now, which is waiting until I noticed the 7577 had dropped off the network (which may take hours), pulling it off the shelf, log in locally, and type “reboot”. Now this script will do it within five minutes of watchdog timer message. It’s a really ugly hack, but it’s something I can do today. Fixing this issue properly requires a lot more knowledge about Realtek network drivers, and that knowledge seemed to be spread across multiple drivers.


Featured image created by Microsoft Bing Image Creator powered by DALL-E 3 with prompt “Cartoon drawing of a black laptop computer showing a crying face on screen and holding a network cable

Proxmox Cluster VM Migration

I had hoped to use an older Dell Inspiron 7577 as a light-duty virtualization server running Proxmox VE, but there’s a Realtek Ethernet problem causing it to lose connectivity after an unpredictable amount of time. A workaround mirroring the in-progress bug fix didn’t seem to do anything, so now I’m skeptical that the upcoming “fixed” kernel will address my issue. [UPDATE: I was wrong! After installing Proxmox VE kernel update from 6.2.16-15-pve to 6.2.16-18-pve, the network problem no longer occurs.] I found two other workarounds online: revert back to an earlier kernel, or revert back to an earlier driver. Neither feel like great options, so I’m going to leverage my “hardware-rich environment” a.k.a. I hoard computer hardware and might as well put them to work.

I brought another computer system online, the hardware was formerly the core of Luggable PC Mark II and mostly gathering dust ever since Mark II was disassembled. I bring it out for an experiment here and there, and now it will be my alternate Proxmox VE host. The first thing I checked was its networking hardware by typing “lspci” to see all PCI devices including the following two lines:

00:1f.6 Ethernet controller: Intel Corporation Ethernet Connection (2) I219-V
06:00.0 Ethernet controller: Intel Corporation I211 Gigabit Network Connection (rev 03)

This motherboard has two onboard Ethernet ports, and apparently both have Intel hardware behind them. So if I run into problems, hopefully it’s at least not the same Realtek problem.

At idle, this system draws roughly 16 watts which is not bad for a desktop system but vastly more than the 2 watts drawn by a laptop. Running my virtual machines on this desktop will hopefully more reliable while I try to get to the bottom of my laptop’s network issue. I really like the idea of a server that draws only around 2 watts when idle so I want to make it work. This means I foresee two VM migrations: immediate move from the laptop to the desktop, and a future migration back to the laptop after its Ethernet is reliable.

I am confident I can perform this migration manually, since I just did it a few days ago to move these virtual machines from Ubuntu Desktop KVM to Proxmox VE. But why do it manually when there’s a software feature to do it automatically? I set these two machines up as nodes in a Proxmox cluster. Grouping them together in such a way gains several features, the one I want right now is virtual machine migration. Instead of messing around with manually setting up software and copying backup files, now I click a single “Migrate” button.

It took roughly 7 minutes to migrate the 32GB virtual disk from one Proxmox VE cluster node to another, and once back up and running, each virtual machine resumed as if nothing had happened. This is way easier and faster than my earlier manual migration procedure and I’m happy it worked seamlessly. With my virtual machines now seamlessly running on a different piece of hardware, I can dig deeper into the signs of a a problematic network driver.

Realtek Network r8169 Woes with Linux Kernel 6

[UPDATE: After installing Proxmox VE kernel update from 6.2.16-15-pve to 6.2.16-18-pve, this problem no longer occurs, allowing the machine to stay connected to the network.]

After setting up a Home Assistant OS virtual machine in Proxmox VE alongside a few other virtual machines, I wondered how long it would be before I encounter my first problem with this setup. I got my answer roughly 36 hours after I installed Proxmox VE. I woke up in the morning with my ESP microcontrollers blinking their blue LEDs, signaling a problem. The Dell Inspiron 7577 laptop I’m using as a light-duty server has fallen off the network. What happened?

I pulled the machine off the shelf and opened the lid, which is dark because of my screen blanking configuration earlier. But tapping a key woke it up and I saw it filled with messages. Two messages were dominant. There would be several lines of this:

r8169 0000:03:00.0 enp3s0: rtl_chipcmd_cond == 1 (loop: 100, delay: 100).

Followed by several lines of a similar but slightly different message:

r8169 0000:03:00.0 enp3s0: rtl_ephyar_cond == 1 (loop: 100, delay: 10).

Since the machine is no longer on the network, I couldn’t access Proxmox VE’s web interface. About the only thing I could do is to log in at the keyboard and type “reboot”. A few minutes later, the system is back online.

While it was rebooting, I performed a search for rtl_ephyar_cond and found a hit on the Proxmox subreddit: System hanging intermittently after upgraded to 8. It pointed the finger at Realtek’s 8169 network driver, and to a Proxmox forum thread: System hanging after upgrade…NIC driver? It sounds like Realtek’s 8169 drivers have a bug exposed by Linux kernel 6. Proxmox bug #4807 was opened to track this issue, which led me down a chain of links to Ubuntu bug #2031537.

The code change intended to resolve this issue doesn’t fix anything on the Realtek side, but purportedly avoids the problem by disabling PCIe ASPM (Active State Power Management) for Realtek chip versions 42 and 43. I couldn’t confirm this is directly relevant to me. I typed lspci at the command line and here’s the line about my network controller:

3b:00.0 Ethernet controller: Realtek Semiconductor Co., Ltd. RTL8111/8168/8411 PCI Express Gigabit Ethernet Controller (rev 15)

This matches some of the reports on Proxmox bug 4807, but I don’t know how “rev 15” relates to “42 and 43” and I don’t know how to get further details to confirm or deny. I guess I have to wait for the bug fix to propagate through the pipeline to my machine. I’ll find out if it works then, and whether there’s another problem hiding behind this one.

So if the problem is exposed by the combination of new Linux kernel and new Realtek driver and only comes up at unpredictable times after the machine has been running a while, what workarounds can I do in the meantime? I’ve seen the following options discussed:

  1. Use Realtek driver r8168.
  2. Revert to previous Linux kernel 5.12.
  3. Disable PCIe ASPM on everything with pcie_aspm=off kernel parameter.
  4. Reboot the machine regularly.

I thought I’d try the easy thing first with regular reboots. I ran “crontab -e” and added a line to the end. “0 4 * * * reboot” This should reboot the system every day at four in the morning. It ran for 36 hours the first time around, so I thought a reboot every 24 hours would suffice. This turned out to be overly optimistic. I woke up the next morning and this computer was off the network again. Another reboot and I could log in to Home Assistant and saw it stopped receiving data from my ESPHome nodes just after 3AM. If the 4AM reboot happened, it didn’t restore the network. And it doesn’t matter anyway because the Realtek crapped out before then.

Oh well! It was worth a try. I will now try disabling ASPM, which is also an opportunity to learn its impact on electric power consumption.


Featured image created by Microsoft Bing Image Creator powered by DALL-E 3 with prompt “Cartoon drawing of a black laptop computer showing a crying face on screen and holding a network cable

Running Home Assistant OS Under Proxmox VE

I’ve dusted off my Dell Inspiron 7577 laptop and set it up as a light-duty virtualization server running Proxmox Virtual Environment. My InfluxDB project and my Plex server both run on top of Ubuntu Server, and Proxmox has a very streamlined process to set up virtual machines from installation media ISO file. I got those two up and running easily.

Setting up Home Assistant OS under Proxmox took more work. Unlike Virtual Machine Manager, Proxmox doesn’t have a great way to import an existing KVM virtual machine image, which is how Home Assistant OS was distributed. I tried three sets of instructions without success:

  • Proxmox documentation describes how to import an OVF file. HAOS is available as an OVA file, which is a tar archive of an OVF plus its associated files. I unpacked that file to confirm it did include an OVF file and tried using that, but the disk image reference was considered invalid by the import tool and ignored.
  • GetLabsDone: I got far enough to get a virtual machine, but it never booted. I got some sort of infinite loop, consuming 100% of one CPU while showing a blank screen.
  • OSTechNix: Slightly different procedure but the same results: blank screen and 100% of one CPU.

Then I found a forum thread on Home Assistant forums, where I learned GitHub user @tteck has put together a script to automate the entire process. I downloaded the script to see what it is doing. I understood it enough to see it closely resembled the instructions on GetLabsDone and OSTechNix, but not enough to understand all the differences. I felt I at least understood it enough to be satisfied it’s not doing anything malicious, so I ran the script on my Proxmox VE instance and it worked well to get Home Assistant OS up and running. Looking at the resulting machine properties in Proxmox UI, I see a few differences. The system BIOS is “OVMF” instead of default “SeaBIOS” and there’s an additional 4MB “EFI disk”. I could try to recreate a Home Assistant VM using these parameters, but since HAOS is already up and running so I’m not particularly motivated to perform that experiment.

A side note on auditing @tteck‘s script haos-vm.sh: commands are on a single line no matter their length, so I wanted a way to line-wrap text files at the command-line and learned about the fold command. Instead of dumping out the script with “more haos-vm.sh” I can line wrap it at spaces with “fold -s haos-vm.sh | more“.

After Home Assistant OS fired up and I could access its interface in a web browser, the very first screen has an option for me to upload a backup file from my previous HAOS installation. I uploaded the file and a few minutes later the new HAOS virtual machine running under Proxmox VE took over all functions with only a few notes:

  • The “upload…” screen spinner kept spinning even after the system was up and running. I saw the CPU and memory usage dropped in Proxmox UI and thought things were done. I opened up a new browser tab to http:/homeassistant.local:8123/ and saw Home Assistant was indeed up and running, but the “Uploading…” spinner never stopped. I shrugged, closed that first spinner tab, and moved on.
  • The nightly backup automation carried over, but I had to manually re-add the network drive used for backups and point the automation back at the just-re-added storage location target.
  • All my ESPHome YAML files carried over intact, but I had to manually re-add ESPHome integration. Then all the YAML files were visible and associated with their respective still-running devices around the house, who seamlessly started reporting data to the new HAOS virtual machine.

I have done several Home Assistant migrations by now, and it’s been nearly seamless every time with only minor adjustments needed. I really appreciate how well Home Assistant handles this infrequently-used but important capability to backup and restore.

After I got Home Assistant up and running under Proxmox VE on the new machine, I wondered how long it’ll be before I run into my first technical problem with this setup. The answer: about 36 hours.

No Further Unity Projects

I’ve just learned some very valuable electronics lessons, and it was helped by KiCad the free open-source electronics design software. It’s a very large suite of tools but having a specific need in front of me (capture reverse engineered schematics of a circuit board) helped me stay focus and get to the “know enough to do what I need to do” point quickly. I’ve also been learning FreeCAD, another piece of free open-source software, but I haven’t reached that point yet. And now I’m adding another piece of open-source software on the “learn enough to do what I need” list: Godot Engine.

Godot is an alternative to Unity 3D, both offering a game development environment and runtime engine. Unity has lots of learning resources online. It adopts new development paradigms like data-oriented programming, new tools like machine learning, and supports new platforms like virtual reality. It also used to have very beginner-friendly terms and conditions, letting aspiring indie game developer hobbyists play around for free and letting small startups launch. Originally the pitch was: “share your success”. Only after a game studio is successful would Unity start requiring payment. Unfortunately, Unity as a business is changing for the worse.

Recently there’s been an uproar in the game development industry as Unity announced new pricing policies to go into effect at the start of 2024. While price increases happen across the economy on everything we buy, this particular case was deeply antagonizing.

  1. Instead of paying royalties on successful games, it could levy a fee upon every game installation regardless of whether it is a revenue-generating context. This means, for example, successful royalty-paying game studios will be charged for every installation of a free demo whether it turns into a sale or not.
  2. Even though it doesn’t take effect until next year, the new policies could apply retroactively. Games currently in development will be held to different terms than what the project started with. Even worse, it applies to games that have already been released!
  3. Before the announcement, these changes were previewed with a few game studios to get their feedback. After receiving some very negative feedback, Unity went ahead anyway.
  4. The worst part: Unity pulled this stunt once before in 2019 and got flamed for it. They walked back those changes and promised “we heard you” and won’t do it again. Now in 2023, they did it again.

Why is this happening? Money, of course! Unity went public in 2020, which meant a management structure incentivized to “maximize shareholder value”. And the most obvious way to do that was to squeeze game developers for as much as they will tolerate. The proposed 2019 changes were originally intended to improve Unity’s financial outlook pre-IPO but backfired. And now it is obvious Unity’s management has failed to learn the lesson.

As of this writing, Unity is on a damage-control footing walking back their announcement. Again. Will it work a second time? I don’t know. It hasn’t escaped people’s notice that the same management mindset that drove headfirst into this train wreck is still in charge. [Update: CEO has resigned, but the board of directors and senior management are still there.] Notably absent from the current retraction is any legally binding obligation preventing them from trying yet again after this current storm blows over.

So “Fool me once”, and all that. Unity’s largest competitor is Unreal Engine whose licensing terms aren’t as generous, but they also lack a history of such underhanded tactics at changing said terms. Unreal will likely pick up Unity customers who need a mature toolset with leading-edge performance and quality. For those without such requirements, like small indie game studios and aspiring game developer hobbyists, maybe none of these Unity changes affect us today. But we should all be deeply concerned that Unity’s free tier may gradually become crippled in the future if not disappear entirely. Thus, alternatives like Godot Engine deserves a look.

Notes on “Getting Started in KiCad”

After making my tiny contribution to the “Getting Started in KiCad” guide, I sat down to actually read through it all. I’ve downloaded and installed KiCad 7.0.7 on my computer and followed along with the tutorial. I found it well-written and very informative for getting me started. Which gave me confidence I can make use of KiCad in the future.

However, the guide assumes the reader is familiar with the basics of electronic circuit design, and just needed to know where to find KiCad has organized various basic functionalities. My hypothesis is that six years ago I didn’t have the prerequisite background knowledge and was thus unable to absorb the lesson to make use of KiCad. If that’s the reason I stopped, I choose to celebrate my growth and hope things turn out better this time.

I don’t know why I had the impression KiCad has tightly coupled symbols and component footprints, because the tutorial made it pretty clear that is not the case. Schematic editor and circuit board layout editor are two completely separate modules, and it’s absolutely possible to draw a schematic with generic symbols (drawing from the stock “Devices” library) and never proceed to layout at all. This bodes well for my intended use of KiCad as a reverse-engineering/learning note-taking tool.

Reverse-engineering means I won’t have control over what components are involved in a design. I certainly won’t have all the technical data for all the components. Which is why I appreciated the tutorial covered how to make custom symbols and footprints, it’s not like I can contact a supplier representative to request technical data. There is an official style guide (“KiCad Library Conventions“) for library symbols and footprints. I skimmed through it, but I don’t understand all of it yet. If I do continue using KiCad, I should revisit this link on a regular basis to better align my own creations with official best practices.

One feature I did not expect to find in KiCad was 3D rendering. Not just the circuit board layout, but a rendering complete with components populated on the board. To do this, a design must have 3D model data associated with the footprint and symbol for a part. The tutorial linked to the FreeCAD StepUp Workbench which bridges FreeCAD and KiCad. It allows using FreeCAD to generate 3D model data for KiCad part libraries, and it also exports KiCad generated 3D data into FreeCAD. The latter allows integrating a circuit board with its associated mechanical components. This sounds like a very powerful capability and, if I ever need such capability, I hope I remember to come back and take a closer look.

For today, I’ve learned enough to use the KiCad schematic editor for my own learning purposes.

My First (Tiny) KiCad Contribution

My current project goal is building a control module for a reciprocating motion actuator salvaged from a Sonicare electric toothbrush. As a side quest to that goal, I’ve decided to pick up learning KiCad again. I played with KiCad 4 around six years ago, but without practice I have forgotten almost everything so I thought I would start at the beginning with KiCad’s “Getting Started in KiCad” guide.

Towards the top of that guide is a “Feedback” section where everyone is invited to help make the project better. Fairly common for free open source projects, but here something caught my eye: a tiny typo of “sumbit” instead of “submit”. Well, they did say they welcome feedback, let me see if I can bring this typo to someone’s attention. I followed the link to instructions on how to “Report an Issue

Most of the instructions regarding filing an issue concern the software, focused as it was on version/build number and software libraries in play. That wouldn’t strictly apply to reporting a typo, but towards the bottom is a link “I have a docs.kicad.org issue” and I followed that to the kicad-doc-website repository on GitLab. Poking around the directory tree, I couldn’t find any of the documentation information. That was because it was the documentation web site infrastructure (Jekyll scripts, etc) and not the documentation itself. What I’m looking for is the “I have a documentation issue” link to a sibling repository kicad-doc.

Poking around the kicad-doc directory tree was more fruitful. I found getting_started_in_kicad.adoc containing the text for that page. My first objective was to see if the problem has already been fixed. I see the typo in the main branch, so the problem is still there. And since I had the source in hand, I copy/pasted it into Microsoft Word to see if the spell checker can find anything else. It highlighted a few debatable differences in convention (Word wanted “mouse wheel” versus the existing “mousewheel”) and some domain-specific terminology (“opamp”.) I decided they were out of scope for my first run. It did find one other clear problem: a typo “subsitution” which is “substitution” but missing the first “t”.

With these two problems in hand, I will now file an issue. First I had to create a GitLab account, which had been on my to-do list anyway. As part of the sign-up process, GitLab forced me to create a repository pre-populated with a guide to GitLab-specific features as well as general git functionality. This is great to onboard someone new to git-powered source control, but it got in my way today. It took a few minutes before I broke out of the enforced tutorial so I can get back to kicad-doc and file issue #864: Misspellings in “Getting Started” Guide.

Once that was done, I figured I might as well try fixing the problem myself. Trying to edit the original source file resulted in a permission denied error, as expected. But it did launch an automated process to handle small single-file edits. It forked the repository into one I could edit, and then immediately package my edits into a merge request. (“Merge request” is GitLab’s slightly different name for GitHub’s “Pull Request” feature.) I thought this automation handling what would otherwise have been a manual multi-step process was pretty cool! After making my two edits, I put #864 in my description so merge request #909 was automatically attached to my issue #864.

At the same time I was building my GitLab merge request, one of the KiCad documentation maintainers (Graham Keeth) saw my issue #864 and fixed it immediately in the main branch, making my MR#909 superfluous. Graham was apologetic about my wasted effort but I was not offended. I wanted to learn the ropes of contributing to KiCad with reporting an issue, the merge request was a stretch goal. I received advice that I could have mentioned I’ll be working on a merge request when opening the issue. I’ll keep that in mind if I find something else in the future. I got feedback my issue was good, so there’s that.

For today, I have the satisfaction of seeing these typo fixes back-ported to the 7.0 documentation branch, and is now live on KiCad site. The Getting Started in KiCad page no longer has typos “sumbit” or “subsitution” and that’s my first tiny little contribution to KiCad. Now onward to actually reading and learning from that page.

Good Time to Revisit KiCad

I am learning what I can from taking apart retired Sonicare electric toothbrushes. After playing with an Sonicare charging base, my attention turned to the old Sonicare HX6530 control board. I had some idea of how a few components might work together, but if I want to follow up my ambition of building my own controller for the salvaged actuator, I need to dig deeper into how such a circuit is built.

A tool I’ll need for this job is a circuit diagram a.k.a. electronic schematic. Making notes in the form of word description will only go so far. I can always draw a schematic by hand, and I’ll definitely be drawing fragments as I probe the circuit. But to get a good picture after that, I should transfer that knowledge into a piece of software designed for schematics. (Versus general purpose graphical software like Inkscape.)

Around 2019 I dabbled in Digi-Key’s online tool Scheme-It but found it limiting. In early 2021 I used the electronics design portion of Autodesk Fusion 360 (derived from Eagle) to draw up reverse-engineered schematics for L298N and DRV8833 motor driver boards I bought off Amazon, as well as a quick stepper motor experiment with ESP32 and TMC2208 drive board. It was serviceable, but then Autodesk yanked on the chain of Fusion 360 subscriptions a little tighter and turned me off on it. I don’t like it when my user experience is at the whim of some Autodesk executive’s decision to seek more revenue, so I decided against investing any more time or money into learning Fusion 360.

What I think I should do is pick up where I left off in late 2017. That’s when I played with KiCad and got as far as getting a board made by OSH Park. I can’t remember why I didn’t continue building my KiCad skills, and annoyed at myself that I didn’t write those reasons down on this blog. (This is my project notebook! This is what it is for!) Since KiCad is free open source software, it wouldn’t have been licensing subscription fees like Autodesk Fusion 360. Perhaps I ran into problems with the software itself? Based on KiCad release history, late 2017 was the tail end of KiCad 4. (KiCad 5 would be released in early 2018.)

As of this writing, KiCad is at version 7.0.7. It would have seen significant advancements during my time away, possibly resolving whatever issues that annoyed me in 2017. Maybe it’s worth another look. At the moment I’m not interested in building a board, I just want to capture a reverse-engineered schematic. I don’t think that necessarily makes things easier as I learn the ropes again, because I remember a very tight coupling between logical schematic symbols (which I care about right now) and physical component footprints (which I don’t.) Even then, I hope the immediate goal would help keep me focused. Which naturally meant I was immediate distracted by a spell-checking side quest to the KiCad side quest.

FreeCAD Notes: Mirror

FreeCAD offers multiple ways to constrain a distance: strictly along vertical axis, strictly horizontal, or the shortest distance between those two points. This is more direct than Onshape’s way of heuristically guessing user intent, and I can see myself learning to like it. What I will miss, though, is Onshape’s sketch mirroring mechanism that can mirror along arbitrary lines and maintain relationship with the original. FreeCAD 0.20.2 doesn’t seem to do either.

Many of my mechanical designs have symmetric features. Just as one example, a commodity micro servo is mounted via two tabs, each held with a small screw. The mounting tab and screw hole is symmetric about the center. I prefer not to duplicate effort by drawing two tabs and two screw holes. In Onshape, i can draw just one side and a line on my sketch representing the center. I can then use the mirror function to generate the other side. If I need to refine my sketch later, I can fine tune dimensions on the side I drew and Onshape will automatically update the mirrored side to reflect my changes.

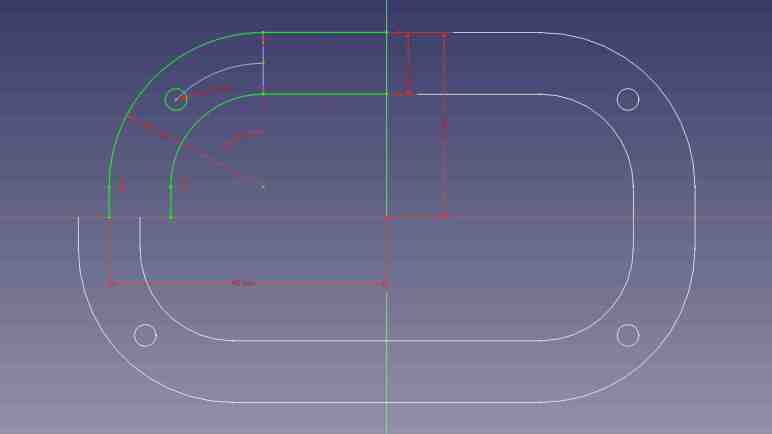
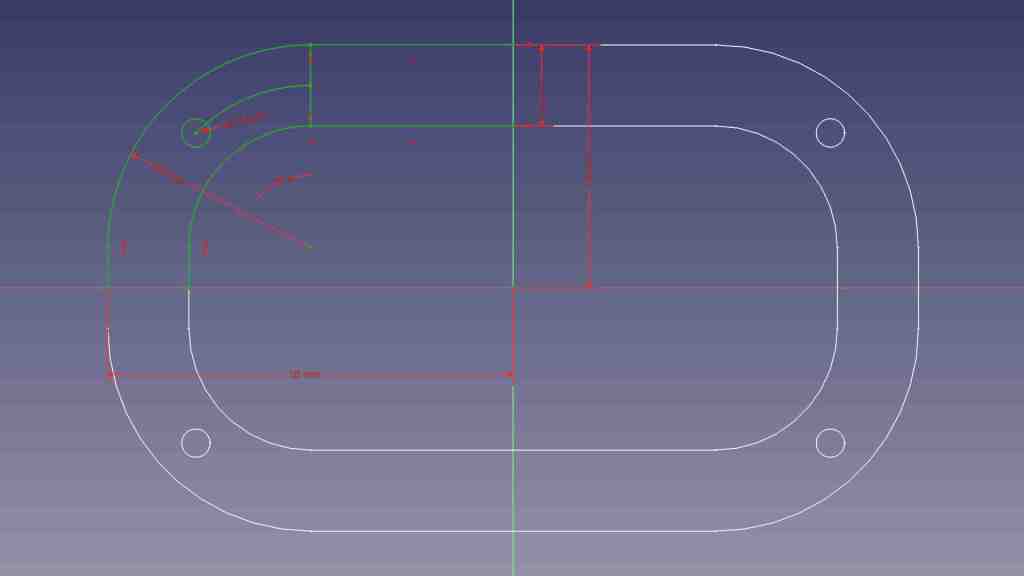
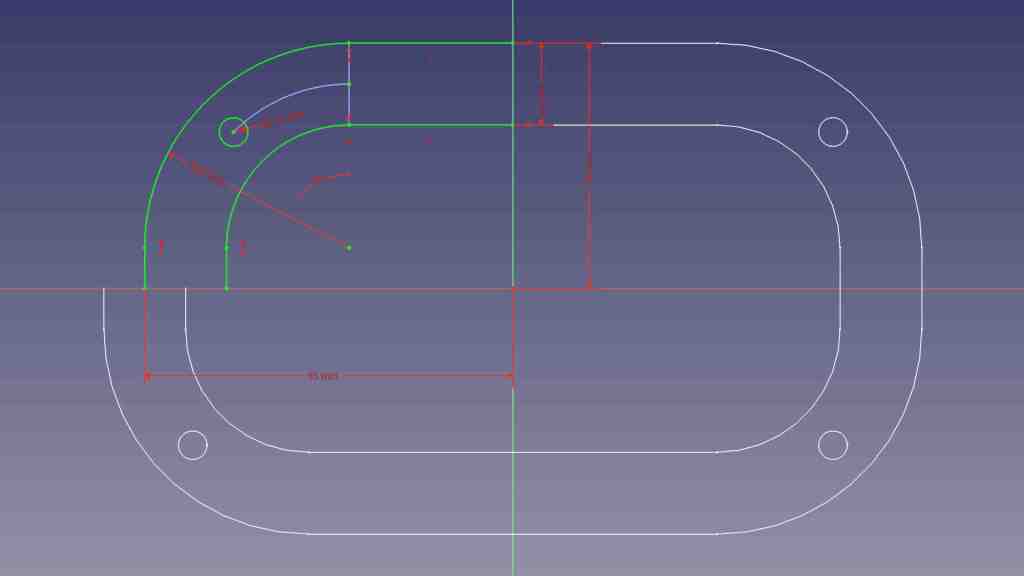
FreeCAD’s Sketcher workbench does have a “Mirror Sketch” feature, but it does not mirror about arbitrary lines in the sketch. It can only mirror about the X axis, the Y axis, or the Origin point which mirrors both X and Y. Here I’ve sketched out one quarter of a symmetric part (Displayed jn green) and mirrored it three times (about X, about Y, and about Origin. Displayed in white.) to create the entire perimeter of this test.

Furthermore, I didn’t get to select which feature to mirror. “Mirror Sketch” mirrors everything in the sketch and placed results in a new sketch, which seems to sever all association with the original sketch.

If I change a dimension in the original sketch, in this experiment the width, none of the mirrors were updated to reflect my change. There’s a “Merge sketches” feature to put everything back into the same sketch, but that doesn’t fix this problem.

There’s a good chance I can accomplish what I want with a different FreeCAD feature, much as how I wanted “Midpoint” and eventually found a solution via “Constrain symmetrical”. But as of this writing I haven’t found my desired functionality. Until I do, sketching symmetric features in FreeCAD will require duplicate effort sketching features that I could mirror in Onshape. I will then have to manually link duplicated features with “Constrain equal” so any future updates to critical dimensions will be properly propagated through symmetric features. This will not be a major dealbreaker against using FreeCAD, just mildly annoyed at the extra effort taking more time.

FreeCAD Notes: Distance

I’m on my FreeCAD learning journey and I’ve had to change some of my Onshape habits. For sketching, I was able to adapt from Onshape’s “Midpoint” constraint to FreeCAD’s “Constrain Symmetrical” once I figured out a workaround to avoid redundancy errors with FreeCAD’s implicit constraints.

I’m generally in favor of having one way to do something instead of offering multiple similar ways, so I’d be OK if it was a deliberate decision not to add a dedicated “Midpoint” constraint when “Constrain Symmetrical” is functionally equivalent. But I doubt it, because that’s not been the typical FreeCAD pattern. It already has two confusingly similar workbenches “Part” and “Part Design“, and multiple competing workbenches for assemblies. (It’s up to “Assembly3” and “Assembly4” now.) And right on the sketching constraints toolbar, where a “Midpoint” may have been deemed redundant, we have three separate tools to denote linear dimension: “Constrain horizontal distance”, “Constrain vertical distance”, and “Constrain distance.”

Each of these have valid use, because these distance constraints are driven by project requirements that may dictate we measure horizontally, measure vertically, or measure the direct line distance. Once I saw these three options listed side by side I immediately understood why they were there, but I was surprised because Onshape handled the problem differently.

In Onshape, there’s just a single dimension operation. In my experience it is usually a direct line measurement equivalent to FreeCAD’s “Constrain distance”. But sometimes I do need to constrain distance along a horizontal or vertical axis. In these cases, Onshape lets me drag the distance number away from the object. If I drag far enough away horizontally, it becomes a vertical distance constraint. The number is recalculated accordingly, and I can edit it afterwards as desired. A horizontal distance constraint is done similarly, by dragging the number away from the object either above or below vertically. This heuristic typically works well, but can be frustrating for features at a shallow angle: I would have to drag pretty far before Onshape understood I don’t want the shallow angle, I want horizontal/vertical.

With that experience in mind, I think I might come to prefer having three distinct and explicit methods to constrain a distance despite my typical preference to have a single way to do something. The only downsides with this approach are a bit of extra screen real estate taken up by the toolbar, and the fact I’ll eventually have to memorize three different keyboard shortcuts to become fluent at FreeCAD.

FreeCAD Notes: Midpoint

In between musing about VR projects and other random ideas, I’ve been returning to FreeCAD and learning my way bit by bit. After my initial introduction to Part Design workbench I’ve been gradually gaining proficiency with it. Learning FreeCAD required changing some patterns I’ve developed while working in Onshape. Such changes were expected for adopting a different software package, so this is not a surprise, but adjustment takes time. The first “that took longer than it should” switchover example was replacing Onshape’s midpoint constraint.

When sketching my design in Onshape, I frequently use the midpoint constraint to keep something in between two other things. Most commonly, I would place a point on a construction line and then select the midpoint constraint. FreeCAD doesn’t have a dedicated “Midpoint” constraint but, for putting a point in the midpoint of a line, I should be able to use the “Symmetrical” constraint to accomplish the same thing. But as soon as I impose the “Symmetrical” constraint on my point and line, everything turns orange indicating some kind of an error. I pressed “Undo” so I could figure out a different way that wouldn’t cause an error. But no matter what I tried, things would turn orange.

After several attempts all ending in orange lines, I thought “Self, go understand the error message!” It took me a minute to figure out where the error was shown in FreeCAD’s interface, but once I did, I saw the error was “Redundant constraints: (61)” This was confusing to me because the point I had placed on the line was definitely not the midpoint, so the “Symmetrical” constraint was definitely required. What was the redundant constraint? FreeCAD’s list of problematic constraint was a single number 61, which told me nothing. Fortunately, the (61) was a link I could click to take me to a “Constrain point onto object” linking the point and line.

How did this happen? When I clicked to place a point on the line, FreeCAD tried to be helpful and automatically added a “Constrain point onto object” between the two. Not knowing this had happened, I blissfully proceeded to add “Constrain symmetrical”. Doing so made “Constrain point onto object” redundant because a line’s midpoint is by definition always on that line.

In other words: FreeCAD implicitly added a constraint and, when I made my wish explicit, complained that my explicit specification collided with its implicit inference. That was annoying, I had nothing to do with that implicit constraint but now I have to deal with it. Or do I? Looking at FreeCAD’s user interface immediately below where “Redundant constraints (61)” was shown, I saw a checkbox for “Auto remove redundants”. Hey, that sounded promising!

Except it was not useful. I checked that option and tried again. When I clicked to add a point on the line, it still added “Constrain point onto object” as before. Then when I added “Constrain symmetrical”, FreeCAD looked at the two conflicting constraints and automatically removed the more recent one: “Constrain symmetrical”. Which is to say, FreeCAD deleted my explicit wish in favor of its own incorrect guess. Bah.

Once I understood what happened, I could devise a workaround. When adding the point, I have to be careful to click in the empty space near the line but not on the line. Doing this meant FreeCAD would not add “Constrain point onto object” so when I explicitly specify “Constrain symmetrical” afterwards there would be no redundancy to cause problems. This would be a minor change in my behavior, and I think I’ll get the hang of it quickly like FreeCAD’s distance constraint feature.

Updating Ubuntu Battery Status (upower)

A laptop computer running Ubuntu has a battery icon in the upper-right corner depicting its battery’s status. Whether it is charging and if not, the state of charge. Fine for majority of normal use, but what if I want that information programmatically? Since it’s Linux, I knew not only was it possible, but there would also be multiple ways to do it. A web search brought me to UPower. Its official website is quite sparse, and the official documentation written for people who are already knowledgeable about Linux hardware management. For a more beginner-friendly introduction I needed the Wikipedia overview.

There is a command-line utility for querying upower information, and we can get started with upower --help.

Usage:
  upower [OPTION…] UPower tool

Help Options:
  -h, --help           Show help options

Application Options:
  -e, --enumerate      Enumerate objects paths for devices
  -d, --dump           Dump all parameters for all objects
  -w, --wakeups        Get the wakeup data
  -m, --monitor        Monitor activity from the power daemon
  --monitor-detail     Monitor with detail
  -i, --show-info      Show information about object path
  -v, --version        Print version of client and daemon

Seeing “Enumerate” as the top of the non-alphabetized list told me that should be where I start. Running upower --enumerate returned the following on my laptop. (Your hardware will differ.)

/org/freedesktop/UPower/devices/line_power_AC
/org/freedesktop/UPower/devices/battery_BAT0
/org/freedesktop/UPower/devices/DisplayDevice

One of these three items has “battery” in its name, so that’s where I could query for information with upower -i /org/freedesktop/UPower/devices/battery_BAT0.

  native-path:          BAT0
  vendor:               DP-SDI56
  model:                DELL YJNKK18
  serial:               1
  power supply:         yes
  updated:              Mon 04 Sep 2023 11:28:38 AM PDT (119 seconds ago)
  has history:          yes
  has statistics:       yes
  battery
    present:             yes
    rechargeable:        yes
    state:               pending-charge
    warning-level:       none
    energy:              50.949 Wh
    energy-empty:        0 Wh
    energy-full:         53.9238 Wh
    energy-full-design:  57.72 Wh
    energy-rate:         0.0111 W
    voltage:             9.871 V
    charge-cycles:       N/A
    percentage:          94%
    capacity:            93.4231%
    technology:          lithium-ion
    icon-name:          'battery-full-charging-symbolic'

That should be all the information I need to inform many different project ideas, but there are two problems:

  1. I still want the information from my code rather than running the command line. Yes, I can probably write code to run the command line and parse its output, but there is a more elegant method.
  2. The information is updated once every few minutes. This should be frequent enough most of the time, but sometimes we need more up-to-date information. For example, if I want to write a piece of code to watch for the rapid and precipitous voltage drop that happens when a battery is nearly empty. We may only have a few seconds to react before the machine shuts down, so I would want to dynamically increase the polling frequency when the time is near.

I didn’t see a upower command line option to refresh information, so I went searching further and found the answer to both problems in this thread “Get battery status to update more often or on AC power/wake” on AskUbuntu. I learned there is a way to request status refresh via a Linux system mechanism called D-Bus. Communicating via D-Bus is much more elegant (and potentially less of a security risk) than executing command-line tools. The forum thread answer is in the form of “run this code” but I wanted to follow along step-by-step in Python interactive prompt.

>>> import dbus
>>> bus = dbus.SystemBus()
>>> enum_proxy = bus.get_object('org.freedesktop.UPower','/org/freedesktop/UPower')
>>> enum_method = enum_proxy.get_dbus_method('EnumerateDevices','org.freedesktop.UPower')
>>> enum_method()
dbus.Array([dbus.ObjectPath('/org/freedesktop/UPower/devices/line_power_AC'), dbus.ObjectPath('/org/freedesktop/UPower/devices/battery_BAT0')], signature=dbus.Signature('o'))
>>> devices = enum_method()
>>> devices[0]
dbus.ObjectPath('/org/freedesktop/UPower/devices/line_power_AC')
>>> str(devices[0])
'/org/freedesktop/UPower/devices/line_power_AC'
>>> str(devices[1])
'/org/freedesktop/UPower/devices/battery_BAT0'
>>> batt_path = str(devices[1])
>>> batt_proxy = bus.get_object('org.freedesktop.UPower',batt_path)
>>> batt_method = batt_proxy.get_dbus_method('Refresh','org.freedesktop.UPower.Device')
>>> batt_method()

I understood those lines to perform the following tasks:

  1. Gain access to D-Bus from my Python code
  2. Get the object representing UPower globally.
  3. Enumerate devices under UPower control. EnumerateDevices is one of the methods listed on the corresponding UPower documentation page.
  4. One of the enumerated devices had a “battery” in its name.
  5. Convert that name to a string. I don’t understand why this was necessary, I would have expected the UPower D-Bus API should understand the objects it sent out itself.
  6. Get an UPower object again, but this time with the battery path so we’re retrieving an UPower object representing the battery specifically.
  7. From that object, get a handle to the “Refresh” method. Refresh is one of the methods listed on the corresponding UPower.Device documentation page.
  8. Calling that handle will trigger a refresh. The call itself wouldn’t return any data, but the next query for battery statistics (either via upower command line tool or via the GetStatistics D-Bus method) will return updated data.

Window Shopping vorpX

Thinking about LEGO in movies, TV shows, and videogames, I thought the natural next step in that progression was a LEGO VR title where we can build brick-by-brick in virtual reality. I didn’t find such a title [Update: found one] but searching for LEGO VR did lead me to an interesting piece of utility software. The top-line advertising pitch for vorpX is its capability to put non-VR titles in a VR headset.

It’s pretty easy to project 2D images into a VR headset’s 3D space. There are lots of VR media players that projects movies on a virtually big screen, and vorpX documentation says it can certainly do the same as the fallback solution. But that’s not the interesting part, vorpX claims to be able to project 3D data into a VR headset in 3D. This makes sense at some level: games engines are sending 3D data to our GPU to be rendered into a 2D image for display on screen. Theoretically, a video driver (which vorpX pretends to be) can intercept that 3D data and render it twice, once for each eye in our VR headset.

Practically speaking, though, things more complicated because every game also has 2D elements, from menu items to status displays, that are composited on top of that 3D data. And this is not necessarily a linear process, because that composited information may be put back into 3D space. Back-and-forth a few times, before it all comes out to a 2D screen. Software like vorpX would have to know what data to render and what to ignore, which explains why games need individual configuration profiles.

Which brings us to the video I found when I searched for LEGO VR: YouTube channel Paradise Decay published a video where they put together a configuration for playing LEGO Builder’s Journey in a Oculus Rift S VR headset via vorpX. Sadly, they couldn’t get vorpX working with the pretty ray-traced version, just the lower “classic” graphics mode. Still, apparently there’s enough 3D data working for a sense of depth on the playing field and feeling of immersion that they’re actually playing with a board of LEGO in front of them.

For first-person shooter type of games using mouse X/Y to look left-right/up-down, vorpX can map that to VR head tracking. When it’s not a first-person perspective, the controls are unchanged. VR controller buttons and joysticks can be mapped to a game controller by vorpX, but their motion data would be lost. 6DOF motion control is a critical component of how I’d like to play with LEGO brick building in VR, something vorpX can’t give me, so I think I’ll pass. It’ll be much more interesting to experiment with titles that were designed for VR, even if they aren’t official LEGO titles.

FreeCAD Notes: Part Design First Impressions

Watching MangoJelly’s FreeCAD tutorials on YouTube, I learned the power of FreeCAD workbenches and how FreeCAD supports different workflows via different combinations of workbenches. While I can follow along with what’s on screen, that’s different from my own personal workflow that I’ve been using with Fusion 360 and Onshape. And it’s not yet clear if FreeCAD can do the same or if I have to change my personal workflow to fit FreeCAD.

The tutorial’s first example uses the Part Design workbench. It is focused on creating a single part and only a single part: any operations that result in multiple pieces (like cutting a shape in half with boolean operation) will be flagged as an error. It is also focused on keeping individual operations simple and process them sequentially. We create a simple shape then modify that shape with additional operations until we reach the shape we want.

I understand this behavior resembles Tinkercad and is intended to be a more beginner-friendly way to reason about object modeling. But I saw two problems pretty immediately in my brief playtime: first, by building up a long chain of operations, modifying any single step will have repercussions on every step that follows. This workflow aimed a loaded gun at the beginner’s feet, just waiting for the dreaded TNP to pull the trigger. Second, by encouraging individually simple steps, it also encourages scattering part feature dimensions across all of those steps. The size of the overall part might be in the first step, but to find the size of a hole cut in that part we have to dig into the chain of operations to find the cutting operation.

These two observations meant Part Design workbench didn’t make a great first impression on me. I prefer to create few sketches up front with almost all of the information. (Ideally just three: top view, side view, front view.) And then build my parts from dimensions in those few sketches. If I change those dimensions afterwards, I expect to have the parts recalculated automatically.

I didn’t see anything that resembled my preferred workflow until part 12, when MangoJelly goes into “Master Sketch”. The tutorial shows how to use master sketch with Part Design workbench, which should mitigate my concerns with the default workflow.

Putting it into practice, though, is going to take more practice. Trying to use my master sketch in Part Design is continually frustrated by some kind of misunderstanding I have with how references work in FreeCAD. At one point I got frustrated enough to ask: “I wonder if this is easy in Part workbench” and tried to extrude my sketch there.

My fumbles in Part workbench created multiple surfaces instead of a solid shape with four holes, reminding me of another beginner-friendly feature of Part Design: it hides all the surface-related features, keeping things focused on solid 3D shapes. This is good, but I have a lot to learn before I can make Part Design workbench do my bidding.

First Impressions: Proxmox VE vs. TrueNAS SCALE

I’ve spent a few hours each on Proxmox VE and TrueNAS SCALE, the latter of which is now hosting both my personal media collection and a VM-based Plex Media Server view of it. Proxmox and TrueNAS are both very powerful pieces of software with a long list of features, a few hours of exposure barely scratched the surface. They share a great deal of similarities: they are both based on Linux, they both use KVM hypervisor for their virtual machines, and they both support software-based data redundancy across multiple storage drives. (No expensive RAID controllers necessary.) But I have found a distinct difference between them I can sum up as this: TrueNAS SCALE is a great storage server with some application server capabilities, and Proxmox VE is a great application server with an optional storage server component.

After I got past a few of my beginner’s mistakes, it was very quick and easy to spin up a virtual machine with Proxmox interface. I felt I had more options at my disposal, and I thought they were better organized than their TrueNAS counterparts. Proxmox also offers more granular monitoring of virtual machine resource usage. With per-VM views of CPU, memory, and network traffic. My pet feature USB passthrough allows adding/removing USB hardware from a virtual machine live at runtime under Proxmox. Doing the same under TrueNAS requires rebooting the VM before USB hardware changes are reflected. Another problem I experienced under TrueNAS was that my VM couldn’t see the TrueNAS server itself on the network. (“No route to host”) I worked around it by using another available Ethernet port on my server, but such an extra port isn’t always available. Proxmox VM could see their Proxmox host just fine over a single shared Ethernet port.

I was able to evaluate Proxmox on a machine with a single large SSD that hosts both Proxmox itself and virtual machines. In contrast, TrueNAS requires a dedicated system drive and additional separate data storage drives. This reflects its NAS focus (you wouldn’t want to commingle storage and operating data) but it does mean evaluating TrueNAS requires a commitment at least two storage devices versus just one for Proxmox.

But storage is easy and (based on years with TrueNAS CORE) dependable and reliable with redundant hardware. This is their bread-and-butter and it works well. In contrast, data storage in Proxmox is an optional component provided via Ceph. I’ve never played with Ceph myself but, based on skimming that documentation, there’s a steeper learning curve than setting up redundant storage with TrueNAS. Ceph seems to be more powerful and can scale up to larger deployments, but that means more complexity at the small end before I can get a minimally viable setup suitable for home use.

My current plan is to skip Ceph and continue using TrueNAS SCALE for my data storage needs. I will also use its KVM hypervisor to run a few long-running virtual machines hosting associated services. (Like Plex Media Server for my media collection.) For quick experimental virtual machines who I expect to have a short lifespan, or for those that require Proxmox specific feature (add/remove USB hardware live, granular resource monitoring, etc) I’ll run them on my Proxmox evaluation box. Over the next few months/years, I expect to better able evaluate which tool is better for which job.