Angular CLI Setup Adventures on MacOS

It was fun to get a taste of Angular completely risk free, without installing anything on my computer courtesy of StackBlitz. I saw enough to believe Angular is worth additional exploration, so it’s time to go ahead and install those developer tools. For this run, I decided to set it up on my Macbook Air running MacOS X Catalina. Following installation directions, Angular CLI installation failed with:

warn checkPermissions Missing write access to /usr/local/lib/node_modules

I probably could get past this problem with sudo, but I looked around for a better way. According to this StackOverflow thread I need to take ownership of a few directories important to Node.JS. Rather than following the list blindly, I only took ownership as needed. Starting with /usr/local/lib/node_modules because that was the specifically named in that error message. After that, I saw a different error:

┌──────────────────────────────────────────────────────────┐ 
│ npm update check failed │
│ Try running with sudo or get access │
│ to the local update config store via │
│ sudo chown -R $USER:$(id -gn $USER) /Users/roger/.config │
└──────────────────────────────────────────────────────────┘

So I grabbed ownership of .config, and all seems sorted on the permissions front. With the CLI tools installed, I tried to create a new app. It appeared to mostly work but towards the end I saw an error:

xcrun: error: invalid active developer path (/Library/Developer/CommandLineTools), missing xcrun at: /Library/Developer/CommandLineTools/usr/bin/xcrun

I have no idea what xcrun had to do with anything. Searching around for what this message might mean, I found a hit on StackExchange explaining this is a very cryptic way to tell me I haven’t yet installed developer tools on my Macbook. In this specific case, git has not yet been installed. I don’t know what xcrun has to do with git, but it appears to be involved in Angular CLI setting up a new project. I guess it calls git init as part of the project creation? In any case, running xcode-select --install got me started. Once git was installed, I configured my required global settings (name and email.) Once that was done I could successfully run the new Angular creation script, whose output at the end confirms it initializes the project as a git repository.

✔ Packages installed successfully.
    Successfully initialized git.

Running ng serve allowed me to load up the boilerplate default Angular application screen in my browser, confirming project creation success and green light to proceed setting up for the tutorial.

Notes on Angular Getting Started Shopping App

Wading into a new domain always means learning a new vocabulary as well. The first thing I read was Introduction to Angular Concepts, knowing full well not all of it would make sense until later. The most valuable thing it taught me is that certain generic-sounding words actually have specific meanings within an Angular context, which is an important lesson to learn while reading documentation. In this case, I have to be careful when coming across words like “modules”, “components”, and “services”.

Angular’s “Getting Started” section starts out with a “Try It” walk through building a sample Angular application. It is a mock shopping app with a product list, a shopping cart, and checkout UI. They do the usual web app things like creating forms (got to have those forms) and communicate over HTTP. Following along with this sample, I got to see the concepts of “components” and “services” put into practice. I’m still a little fuzzy on “modules”, though. I believe it is because modules don’t really come into their own until we have a much larger project. At which point it makes sense to group lots of components into modules, something that would not be necessary in a small sample tutorial.

I also got to see the good and bad sides of using TypeScript. The good news is that some mistakes will trigger compile-time errors for me to fix before proceeding. I find this a vast and compelling improvement over JavaScript standard operating procedure of watching things going awry at runtime and trying to debug what went wrong. The bad news is that it’ll take some experience before I can understand what those error messages are trying to tell me. Here’s one example of an error message that I found bewildering. It wasn’t immediately obvious to me that I used too many curly braces, three instead of two.

Template parse errors:
Parser Error: Missing expected : at column 9 in [ {{{product.name}}} ] in ng:///AppModule/ProductListComponent.html@3:6 ("

<div *ngFor="let product of products">
<h3>[ERROR ->]
{{{product.name}}}
</h3>
"): ng:///AppModule/ProductListComponent.html@3:6
Parser Error: Unexpected end of expression: {{{product.name}}} at the end of the expression [ {{{product.name}}} ]

Going through the exercise I learned that an Angular component typically associates the three parts of web development (HTML, CSS, JavaScript) into a functional unit. The JavaScript file defines the component class. The HTML is modified with Angular-specific annotations and called the component template. And the component style sheet was a pleasant surprise, since I had struggled with how to best organize my style sheet files in earlier projects. Hopefully Angular components will make it easier.

I felt it was an effective introduction, giving a quick tour of major components of Angular and giving me enough of a vague idea of what’s going on, enough to proceed further and learn more. But before I go deeper into Angular, a little detour to look at the infrastructure behind this “Try It” walkthrough.

Siren Call of Angular Material

I started thinking about doing another web technology project because I thought it might be good to have the option of building my own custom Node-RED Dashboard widgets. But during my research of study prerequisites I started reading about Angular. The more I read, the more I think it’s worth a closer look. I was enticed by the following:

  • It is a web technology of the SPA (single page application) era, moving more processing to the web browser and reducing load on the web server. Google has obvious incentive to reduce their server load, but it also means SPAs can be compiled down to static content and hosted on any web server. For hobbyist projects, this drops the minimum hardware requirement from a Raspberry Pi (to run something like Ruby on Rails) down to an ESP32 (static web server).
  • Angular is built on TypeScript, which adds compile-time type checking capabilities to JavaScript. Potentially eliminating a lot of JavaScript runtime failures that have frustrated me in the past.
  • And last but definitely not least: Angular Material components

Angular Materials is now my primary motivation, displacing Node-RED Dashboard. I’ve been fascinated by Google’s Material Design ever since the concept was launched. This is not a surprise to anyone who’ve seen my web technology projects. The SGVHAK rover UI was built on an early version of Materialize CSS. It gave me a Material Design look but with usage semantics somewhat resembling Bootstrap. My LRWave project was written using completely different set of tools, but it also picked up a Material Design style by the use of Material Design Components (MDC) for Web.

So the siren song call of Material Design has pulled me in yet again, this time to Angular and the promise of being able to build UI for projects that can be hosted anywhere… from static servers like an ESP32 or GitHub Pages, to full fledged web server running on a Raspberry Pi, to desktop applications via ElectronJS.

It all sounds very attractive for a tool to add to my toolbox, so I’ll start investing some time into learning Angular.

Diving Into Web Technologies Again

Digging into an obscure button was fun, but (sadly?) not the main focus of this blog, which is for me to write down notes about my projects and technology explorations. If anyone finds the information useful, that’s just icing on the cake.

This time around, getting back to “work” puts focus on software development. My learning experience with the Node-RED Dashboard taught me it was very easy to get a functional browser-based UI up and running giving users like myself a fantastic way to build out ideas. But with ease of use comes the usual trade-off of limited control. The people behind Node-RED Dashboard is aware of this, providing anyone who is unsatisfied with the default tools an entry point to add custom dashboard widgets. Unfortunately, the learning curve climbs sharply upwards for me since I have little experience with many of the underlying technologies. If I want to explore that world, I have to weigh the following points:

  1. No experience with AngularJS (a.k.a Angular v1) which is the foundation of Node-RED Dashboard.
  2. No experience with Angular (a.k.a. Angular v2+) which is an incompatible but currently-maintained replacement.
  3. No experience with creating reusable JavaScript modules or the convention around creating packages.
  4. Only basic skills with HTML, CSS, and JavaScript.

This list is sorted roughly in the order of most- to least-specific to my original motivation of creating custom Node-RED widgets. With such a list it usually makes the most sense to start at the top (focus on the motivating goal) or start at the bottom (build a solid foundation.)

For the purposes of foundation building, I’ve tackled a few HTML/CSS/JavaScript projects but nothing that really stuck with me for long term development. An early example was the web based UI for SGVHAK rover, which eventually became my default control scheme for Sawppy rover as well. Updating that UI has been on my to-do list ever since, and I have yet to get back to it. I later explored a different set of web development tools with my LRWave project, but again that had been set aside after v1.0 was complete. Given this track record, I’m not sure retreading the same grounds will give better results.

So what about the other side? Start with AngularJS? I was ready to do so because of Node-RED Dashboard, but most of my motivation evaporated when I learned AngularJS has been abandoned. If I want to learn something that’ll be useful beyond Node-RED dashboards, I should learn its successor Angular instead.

But there was also a more vain attraction to Angular that called to me…

Node-RED Challenge Round 2: Bluetooth Low Energy

My first challenge to Node-RED was a success: I was able to read battery voltage and charge percentage from a slow Samsung 500T tablet stuck on an old 32-bit build of Windows 10, and the hardest part of that process was retrying installation after it timed out because the computer was so slow.

This next challenge is significantly more difficult: connect to peripherals via Bluetooth Low Energy. Despite Bluetooth in the name, BLE is actually a completely different protocol from the earlier grand wireless protocol to rule them all. (Sometimes called “Bluetooth Classic” now.) But it is now administered by the same consortium,. so there we go.

As its name implies, a primary goal for BLE is reducing power requirements to make it feasible for battery powered devices. And in this context “battery” is not a gigantic brick of rechargeable lithium-ion cells, BLE wants to be practical for devices to run for months on little coin cell batteries. It’s new, with its own set of rules, and tricky to get right. Thus the perfect advanced level challenge.

This time the hardware is the HP Split X2 from NUCC, an old Windows laptop with built-in Bluetooth. It has a decent processor and RAM but hobbled by an old hard drive that’s difficult to upgrade. As a result installing Node-RED took almost as long as it did on the Samsung 500T’s slow eMMC storage, but at least the CPU was fast enough to avoid a timeout.

The Node-RED extension of interest here is node-red-contrib-noble-bluetooth. Out of all the nodes claiming Bluetooth capability, this one seems to be the one that has general BLE capability (not tied to specific devices) and updated most recently. I installed that extension, started a query for nearby BLE devices, and Node-RED crashed. Not throwing an error that a flow might try to handle, not an error message, Node-RED itself crashed with an error thrown by Noble.

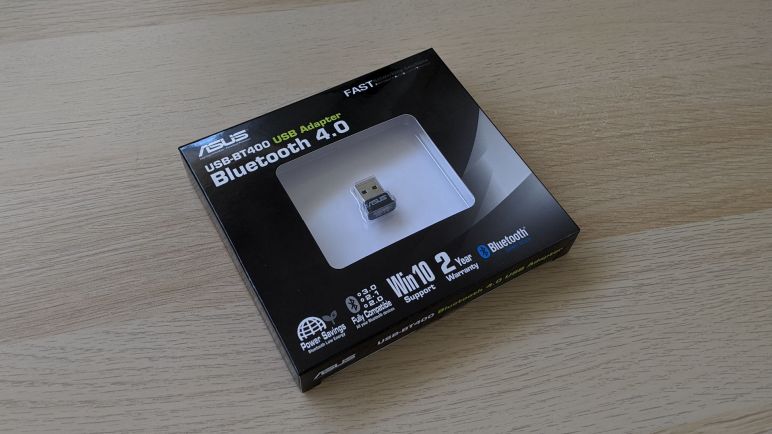
No compatible USB Bluetooth 4.0 device found!

Ah well, I didn’t expect it to be as easy as reading battery level and fully anticipated some bumps on the road to this advanced challenge. Time to do a little investigation.

Node-RED Challenge Round 1: Battery Level Reporting

When I discovered Node-RED and its vast library of community contributions, I checked for several pieces of functionality that might enable several different projects ideas on my to-do list. One of them was the ability to query battery discharge level on a computer.

This was a follow-up to my earlier project assigning a Samsung 500T tablet to display an ISS track around the clock. When I last left that project, I modified the tablet so it runs on my small solar power array. But the arrangement was not optimal: the tablet is constantly pulling power from the array storage battery, instead of contributing its own battery to help store solar energy.

I had the thought to integrate that battery in an automated fashion. There are several ways it could go, but an important data point is battery discharge level. It is the key piece of information in any algorithm’s decision to charge the tablet during the day and let it run on battery at night.

This is something I knew I can accomplish by writing a bit of code. I need to find the APIs to query battery level, then I need to write code to extract that information and do something with it. None of that were technically challenging tasks, but I never allocated the time to do it.

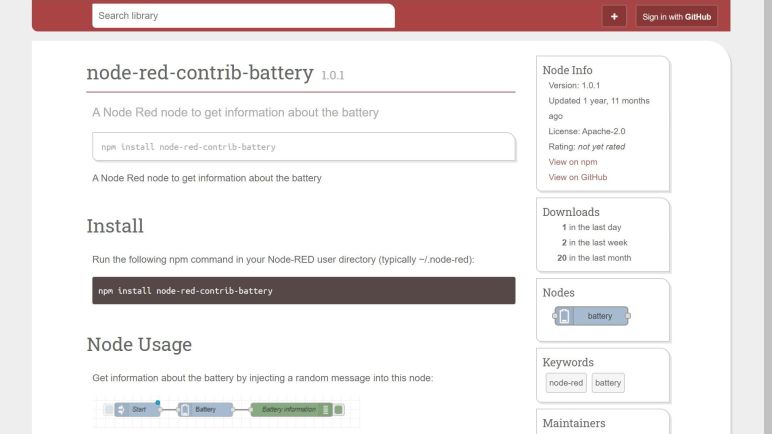
Now I have Node-RED and its library of tools, which included node-red-contrib-battery purported to report battery information in a common way across Linux, MacOS, and Windows. If it works as advertised, all that battery query coding I kept putting off could be as simple as hooking up some nodes. It’s definitely worth trying.

Node-RED Community Contributions

Evaluated in isolation as a novel way to program computers, Node-RED scores high. I got up and running with my serial communication projects much more quickly than writing code in a UWP application, it was easy to plot a graph of data fed by my Mitutoyo SPC connector project. While I did have to climb the learning curve of a new way of thinking and a new set of vocabulary, but once I climbed it (pretty shallow, all things considered) I understood another huge attraction of Node-RED: the collection of community contributions.

I got a brief glimpse of this when I installed the Node-RED Dashboard extension, where I went in to the extension menus to search for Dashboard. The fact there was a search function implies a sizable number of extensions, so I made a note to check it out later. This was affirmed when I went to search for the serial port node, but again I put it off to later.

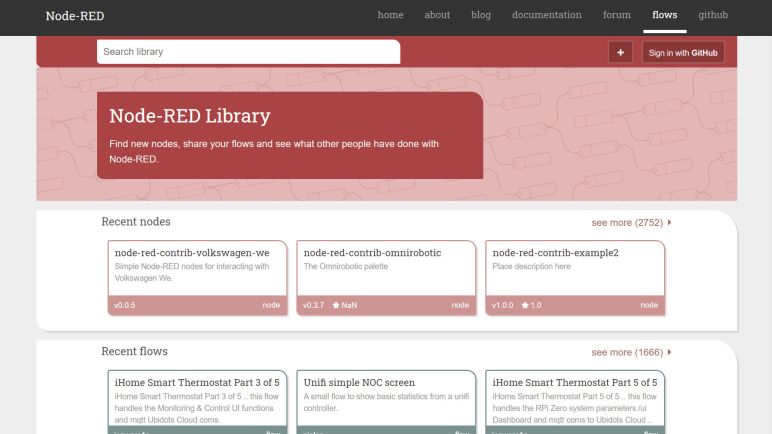
Returning to browse the “Flows” directory of Node-RED, I’m very excited by the extensive toolbox people have shared and made easily usable by others. This is a clear sign of a virtuous cycle at work: an attractive and useful tool attracts a seed group of users on its own merits. These users share their improvements, making the tool more useful and attractive to other users, and the cycle repeats until we have a big toolbox with contribution by people everywhere.

I queried for functionalities that I knew I would need for many projects on the hypothetical to-do list. Majority of queries came back with something that looked promising. After a few successful hits in a row, I was half expecting to find a Node-RED extension to control a webcam attached to a 3D printer carriage. Alas, no such extension existed to trivialize my current project. Fortunately, there’s a community contributed battery information node that could pick up where a past project left off, so I’ll try that first.

Tracking History of a Node-RED Project

Exploring Node-RED has been a lot of fun, working with both the freedoms and limitations of a different way of programming. It was novel enough that a very important part of software development workflow didn’t occur me until I had a nontrivial program: Without source code text files, how do I handle source control? Thankfully it turns out there are still text files behind the scenes of graphical flows, and I can use them with git just like any other software development work.

There are two options: doing it automatically via integrated git client, or manually. The procedure to setup integrated git client is outline in Node-RED documentation but I’m not sure I’m ready to trust that just yet. There’s an additional twist: it requires that I have my git credentials sitting on the computer running Node-RED, which isn’t something I’m necessarily willing to do. I keep a strict watch over the small set of computers authorized with my git credentials for software work. In contrast, a computer running Node-RED is likely only running Node-RED and not used for any other development. (This is especially true when Node-RED is only running in a FreeBSD Jail on my home FreeNAS server, or a Raspberry Pi.)

As a side note, the git integration instructions did explicitly confirm something I had suspected but hadn’t found confirmation before: “Node-RED only runs one project at any time.” This makes the FreeBSD Jail approach even more interesting, because running multiple isolated Node-RED projects on a single physical machine can be done by keeping each in their own jails.

Back to source control: for the immediate future, I’ll use a manual workflow. Under Node-RED’s main menu is the “Export” option. I can click “all flows” to include every tab, click “formatted” to make it readable, and click “Download” to receive a text file (in JSON, naturally) representing my Node-RED project.

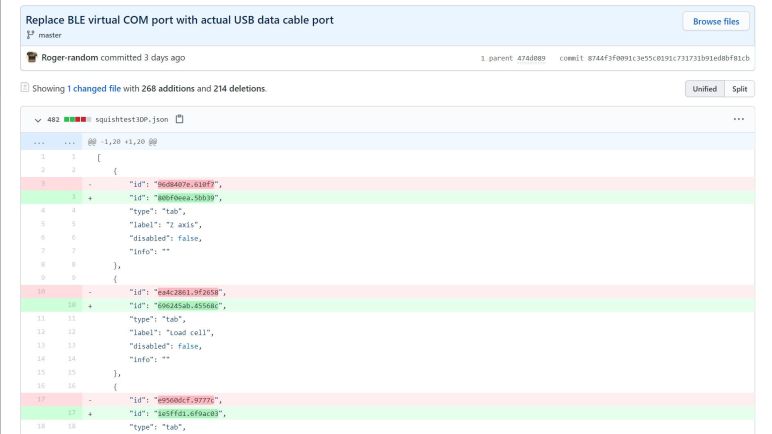
By doing this on one of my machines configured for git access, I can put this file in a git repository for commit and push operations. Regretfully, the file is not terribly readable in its native form, and the GitHub text diff mode is cluttered with a lot of noise. There are many generated id fields linking things together, and those ID tend to change from one download to the next. However, it is far better than nothing and at least all the important changes are also visible within the noisy churn.

To verify that I could restore a project, I set up Node-RED on another computer and imported the flows. All the nodes in my visible flow appear to have survived the transition, but I’ve run into some sort of problem with the configuration nodes. Serial communication nodes lost their COM port information like baud rate, timeout, and line termination. This is odd, as I could see that information in the exported JSON. Similarly, my dashboard layout has been lost in the transition. Hopefully this is only a matter of a beginner’s mistake somewhere. For now it is relatively easy to manually restore that information, but this would quickly become a big headache as a project grows in size.

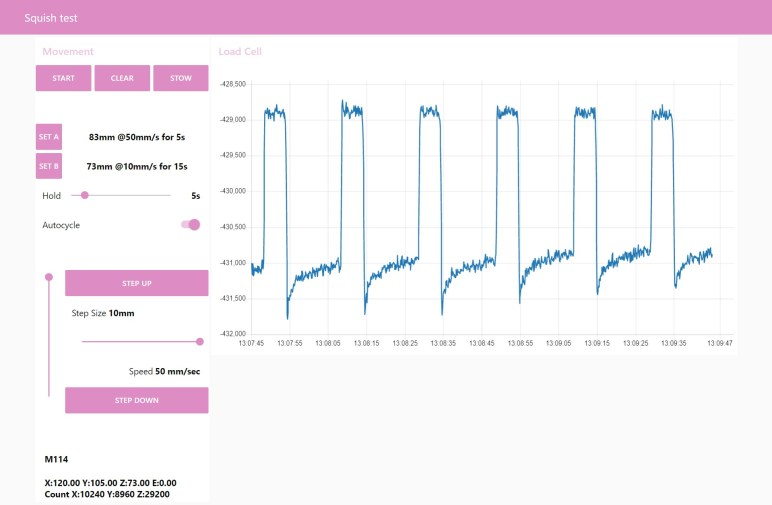
[I have no idea why anyone would want it, but if someone desires my air bubble packing material squish test flow, it is publicly available on GitHub.]

Fast and Easy UI via Node-RED Dashboard

In addition to JSONata, there’s another very important project that is technically not part of core Node-RED. But it is rare to see one without another, and I’m speaking of the Node-RED Dashboard add-on module.

Every single Node-RED project I’ve seen makes use of the Dashboard module to build a HTML-based user interface. Which was why when I started learning Node-RED tutorials I was confused there were no mention of how to build an user interface. It took some time before I realized the Dashboard is not considered part of the core system and had to be installed separately. Once installed, there were additional nodes representing UI and additional editor interface. (Some UI to build UI…)

Once I finally realized my misconception and corrected it, I was able to build a functional interface in less than ten minutes, an amazingly short time for getting up and running under a new user interface construction system. Basic input controls like buttons and sliders, basic output controls like gauges and charts, they all worked just by connecting nodes to feed data.

However, the layout options are fairly limited. While it is extremely easy to build something closely resembling what I had in mind, I see no way to precisely adjust layout details. The rest of Node-RED reminds me of snapping LEGO pieces together, but the Dashboard exemplified the feeling: I can quickly snap together something that resembles the shape I had in mind, but if a distance is not an even number of LEGO stud spacing, I’m flat out of luck.

But even if I don’t see options for custom layout, I found instructions for building my own display widgets. Node-RED Dashboard is built on AngularJS a.k.a. Angular 1.x. I’m not sure I want to invest the time to learn AngularJS now. I can probably pick up enough AngularJS to do a custom widget if all I want is that single widget and reuse everything else. But AngularJS is currently on long-term support status receiving only security updates. Fortunately the fact Node-RED Dashboard is an add-on means people can (and have) built their own dashboard using other UI frameworks by hooking into the same extensibility mechanisms used by Dashboard. So if I want precise control over layout or other custom mechanism, I can do that while still using Node-RED as the underlying engine. I’m impressed we have that extremely powerful option.

But those dreams of grand expansion and customization are for the future. Right now I still need to build experience working with the system, which means putting it to work on a simple test project.

JSONata Reduces Need For Node-RED Function Nodes

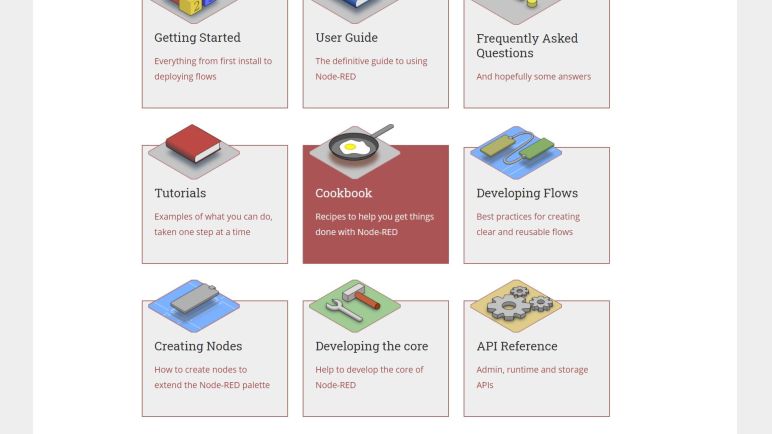
Node-RED is built on sending messages from one node to the next. While there are some recommended best practices, it is really a wide-open system giving users freedom on how to structure the relationship between their nodes. As for the messages, they are JavaScript objects and there’s a convention to structuring them within a Node-RED project. While I can always fall back to writing JavaScript to work with messages, for the most part I don’t have to. Between the Cookbook and the Best Practices document, there are many methods to accomplish some commodity programming flow control tasks without dropping to a JavaScript function node.

But the built-in nodes have limited data manipulation capabilities. So I thought anything that requires actual data manipulation requires dropping to code. I was pleasantly surprised to find I was wrong: simple text changes and similar manipulation can be done without dropping to a JavaScript function node, they can be done with a JavaScript-based query and transformation language called JSONata.

JSONata appears to be an independent project not directly related to Node-RED, but it fits in very well with how Node-RED works and thus widely supported by many property fields of nodes. Any JavaScript string or data manipulation that could fit within a line or two of code can probably be expressed in JSOSNata, and thus accomplished directly in a standard Node-RED field without requiring dragging in a fully fledged JavaScript function node.

JSONata is yet another novelty in my exploration of Node-RED. I can vaguely sense this can be tremendously powerful, and I look forward to experimenting with this capability for future projects. But there’s another technically-not-core Node-RED feature that I will definitely be using, and that is the Node-RED Dashboard.

Node-RED Recommended Best Practices

Learning a new programming language, especially one with an entirely different paradigm, is confusing enough without having to worry about best practices. But after climbing enough of the learning curve, things quickly start getting chaotic and a little structure would help. I found this to be even more true for flow-based programming in Node-RED because a growing collection of nodes and wires connecting them can quickly grow into spaghetti code in a more literal sense than what I’ve been used to. A blank and pristine Node-RED flow doesn’t stay neat and pristine for long.

Fortunately, Node-RED documentation has a section called Developing Flows to help poor lost souls like me. It collects some basic recommendations for keeping flows manageable. And just like the Cookbook, it made more sense for me to read them after getting some hands-on experience building a bird’s nest of crossed wires and scattered nodes.

I felt sheepish to learn that I can have multiple tabs in the editor workspace. I should have noticed up top with a shape surrounding the name “Flow 1” and the plus sign to its right, but I had missed it completely. Each tab is a flow and when the project is deployed, all tabs (flows) execute simultaneously in parallel in response to their respective messages. This inherent parallelism does indeed remind me of LabVIEW.

Obviously multiple tabs make it easy to have unrelated features running in parallel, but what if they need to communicate with each other? That’s where I can use the link-in and link-out nodes. The set of link-in and link-out nodes with matching names act as wires connecting those nodes together.

They can also be used to declutter wires within a single flow. They still act the same way, but when one of the nodes is clicked, a dotted line representing the wire is visible on screen to make it easy to trace flow. Once unselected, the dotted line disappears.

A set of nodes can be combined together into a single “subflow“. In addition to decluttering, a subflow also aids in code reusability because a single subflow can be used multiple times in other flows and they all execute independently.

And finally, multiple adjacent nodes within a flow can be associated together as a group. The most obvious result is visually identifying the group as related. The editor also allows moving all the nodes in the group as a single unit. Beyond that, I don’t know if there are functional effects to a group, but if so I’m sure I’ll find them soon.

As an ignorant beginner, my first thought to flow organization most closely resembled groups. Which is why I was a little surprised to read it was added only very recently in 1.1.0. But once I read through the best practices recommendation in this Developing Flows section, I learned of all the other aspects of keeping flows organized, and I can see why groups hadn’t been as critical as I originally thought.

On the other side of the coin, as I explored Node-RED I found several other software modules that are deeply ingrained in many Node-RED projects, but aren’t technically a part of Node-RED. JSONata is one of these modules.

Node-RED Cookbook Was More Useful After Some Experience

The Node-RED User’s Guide helped me get started as a beginner on a few experimental flows of my own, slowly venturing beyond the comfort of JavaScript functions. But it was a constant process of going back and forth between my flow (which is not working) and the user’s guide to understand what I was doing wrong. I had fully expected this and, as far as beginner learning curves go, Node-RED is not bad.

On the Node-RED Documentation page, a peer of the User’s Guide is the Cookbook. I thought its subtitle “Recipes to help you get things done with Node-RED” was promising, but as a beginner I could not make use of it. It listed some common tasks and how to perform those tasks, but they were described in Node-RED terminology (‘message’ ‘flow’) which I as a beginner had yet to grasp. I couldn’t use the recipes when I didn’t even understand the description of the result.

Continuing the food preparation analogy: If I didn’t understand what “Beef Wellington” was, I wouldn’t know if I wanted to cook it, or be able to find the recipe in the book.

So to make use of the Node-RED cookbook, I had to first understand what the terms mean. Not just the formal definition, but actually seeing them in practice and trying to use them a few times on my own. After a few hours of Node-RED exploration I reached that point, and the Node-RED cookbook became a powerful resource.

I don’t know how the Node-RED Cookbook could make this any easier. It’s the kind of thing that was opaque to me as a beginner, but once I understood, everything looks easily obvious in hindsight. I stare at the cookbook descriptions now, and I don’t understand how I couldn’t comprehend the same words just a few days ago. I wish I could articulate something useful and contribute to help the next wave of beginners, because that would be amazing. But for now I can only be the beginner, consuming existing content like a Best Practices guide.

Node-RED Function Nodes Are A Comforting Fallback

Node-RED beginners like myself are given some hand-holding through two tutorials, creatively titled Creating Your First Flow and Creating Your Second Flow. After that, we are dropped into the User’s Guide for more information. The Using Node-RED section of that page covers fundamentals to get up to speed on how to work in a Node-RED project. Within that section, the page I found most instructive and informative is Using the Function Node.

Part of this might just be familiarity. A function node is a node that encapsulates a JavaScript function for doing whatever the author can write JavaScript to do. Because I’m familiar with languages like C and Python, I’m comfortable with the mentality of writing functions in source code to do what I have in mind. So seeing the function node and all I can do within it is comforting, like seeing a familiar face in a new crowd.

And just as in real life, there will be some level of temptation to stay in the comfort zone. It is probably possible to write any Node-RED program with just three nodes: an input node, a single Function node with a lot of JavaScript code, and an output node.

But writing all my logic in a single JavaScript function node would be ignoring the power of the platform. Flows allows me to lay out my program not in terms of functions calling one another, but in terms of messages flowing from one node to the next. Each node is an encapsulated representation of a feature, and each message is a piece of information that was generated from one node to inform another node on what to do next.

This is a different mentality, and it’ll probably take a bit of practice for me to rearrange my thinking to take advantage of the power of the platform. But while that transition is taking place, I expect to get occasionally stuck. But I know I can unblock myself by resorting to little pieces of JavaScript programming inside a big data flow program, and that’s a good confidence builder for me to proceed building some hands-on experience with Node-RED. I needed that experience before I could understand additional Node-RED resources like the Cookbook.

New Exploration: Node-RED

While researching LabVIEW earlier, I came across several forum threads from people asking if there’s a cheaper alternative. I haven’t come across any answers for a direct free open source competitor, but a few people did mention that LabVIEW’s data flow style of programming had some superficial similarities to Node-RED. With the caveat they are very different software packages targeting different audiences.

Still, it sounded interesting to look into. This was reinforced when I saw Node-RED in a different context. An enthusiastic overview on Hackaday, with a focus on home automation processing data distributed via MQTT. My current project is focused on a single machine and not distributed across many network nodes, so I’m not going to worry about MQTT for the time being, but the promise of an easy way to consume, process, and visualize data is quite alluring. I’ll use my newly assembled load cell as a data source and learn how to integrate it with Node-RED.

But before that can happen, I need to install Node-RED and run through the beginner tutorials. There are many options but the easiest way for me is to install Node-RED is a community-contributed plugin for FreeNAS. This gives me an one-click procedure to install Node-RED into a FreeBSD Jail on my FreeNAS home server. And if I decide I didn’t like it, it is also a one-click cleanup.

The simplicity of setup, unfortunately, also means a lack of choice in basic configuration. For example, I have no idea how to properly secure a Node-RED instance installed in this manner.

But that’s not important right now, because the one-click plugin install has fulfilled the purpose of having Node-RED up and running for me to try beginner tutorials elaborately named “Create your first flow” and “Create your second flow“. Though partway through tutorials I got distracted by the National Weather Service web API.

Fun with C# Strings: Interpolation and Verbatim

Relating to my adventures exploring iconography, this UWP application exercise also managed to add some novelty to a foundational concept: strings. Strings of characters to represent human readable text is a basic part of computer programming. Our very first “Hello World” program would use them… for the “Hello World” is itself a string! Even if someone learning programming had not yet covered the concept of strings, they use it right from the start. As such a fundamental building block, I had no reason to expect to find anything interesting or novel when I wrote C# code. It looks like C, so I assumed all strings behaved like C.

I was surprised to learn my assumption was wrong: there are some little handy syntactic shortcuts available in a C# program. Nothing that can’t be done some other way in the language and certainly nothing earth shattering, but nifty little tools all the same. I was most fascinated by the special characters.

The first one is $, the string interpolation prefix. I first came across it in a sample program that made generating some text output more succinct. It allows us to put variable names inline with the text and some tool in the compilation chain will handle the details of interpreting variable values as text and build the string for display. It definitely made the sample code easier to read, and can be nice in my own programs as well. It made code for my own simple logger easier to read. There is some minor security concern here as automatic interpolation risk introducing unexpected behavior, but at least for small play projects I’m not concerned.

The other special character is @, call the verbatim identifier. It disables almost all string processing for escape sequences, making it easy to use strings that have file paths: we no longer need to worry about the slashes accidentally becoming an escape character. It’s not something terribly common in my projects, but I do have to deal with paths and when I do so in C# this is going to reduce a lot of annoyance. And in direct contrast to interpolation, verbatim may actually cut down on security attack surface by making sure nothing unexpected can occur with escape sequences by eliminating the behavior completely. More tools in the toolbox is always good.

Icon Fun with Segoe MDL2

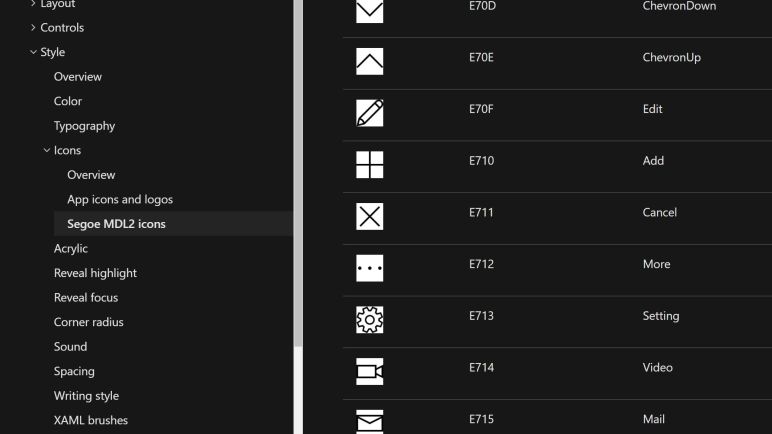
For my recently completed test program, I wanted arrows to indicate motion along X/Y/Z axis. I also wanted a nice icon to indicate the button for homing operations, plus a few other practical iconography. Thankfully they are easily available to UWP applications via Segoe MDL2.

One of the deepest memories from my early exposure to a graphical desktop environment is the novelty of vector fonts. And more specifically, fonts that are filled with fun decorative elements like dingbat. I remember a time when such vector fonts were intellectual property that need to be purchased like software, so without a business need, I couldn’t justify buying my own novelty font.

The first one I had impression of being freely available and didn’t quickly disappear was Webdings, a font that Microsoft started bundling with Windows sometime around the Windows 98 timeframe. I no longer remember if earlier versions of Windows come bundled with their own novelty fonts, but I have fond memories of spending far too much time scrolling through my Webdings options.

Times have moved on, and so have typefaces and iconography. For their UWP application platform, Microsoft provided an accompanying resource for Fluent Design icons called Segoe MDL2. And again, I had a lot of fun scrolling through that page to see my options.

I was initially surprised to see many battery icons, but in hindsight it made sense as something important for creating UI on portable computing devices. There were several variants for battery styline. Including vertical and horizontal orientations and charging, not charging, or battery saver. And each style had ten levels to indicate battery level 10% apart. Some of the code point layouts were a little odd. For example, Battery0 (0xE850) through Battery9 (0xE859) were adjacent to each other, but a full Battery10 was some distance away at 0xE83F. I don’t know why, but it adds an unnecessary step to convert a battery percentage value to a corresponding icon in Segoe MDL2.

The one that made me laugh out loud? 0xEBE8, a bug.

Simple Logger Extended With Subset List

One of the features about ETW I liked was LoggingLevel. It meant I no longer had to worry about whether something might be too overly verbose to log. Or that certain important messages might get buried in a lot of usually-unimportant verbose details. By assigning a logging level, developers have the option to filter messages by level during later examination. Unfortunately I got lost with ETW and had to take a step back with my own primitive logger, but that didn’t make the usefulness go away. In fact I quickly found that I wanted it as things got complex.

In my first experiment Hello3DP I put a big text box on the application to dump data. For the second experiment PollingComms I have a much smaller text area so I could put some real UI on the screen. However, the limited area meant the verbose messages quickly overflowed the area, pushing potentially important information off screen. I still want to have everything in the log file, but I only need a subset displayed live in the application.

I was motivated to take another stab at ETW but was similarly unsuccessful. In order to resolve my immediate needs I started hacking away at my simple logger. I briefly toyed with the idea of using a small database like SQLite. Microsoft even put in the work for easy SQLite integration in UWP applications. Putting everything into a database would allow me to query by LoggingLevel, but I thought it was overkill for solving the problem at hand.

I ended up adding a separate list of strings. Whenever the logger receives a message, it looks at the level and decides if it should be added to the subset of string as well. By default I limited the subset to 5 entries, and only at LoggingLevel.Information or higher. This was something I could pass into the on screen text box to display and notify me in real time (or at least within ~1 second) what is going wrong in my application.

Once again I avoided putting in the work to learn how to work with ETW. I know I can’t put it off forever but this simple hack kicked that can further down the road.

[This kick-the-can exercise is publicly available on GitHub]

Communicating With 3D Printer Added A Twist

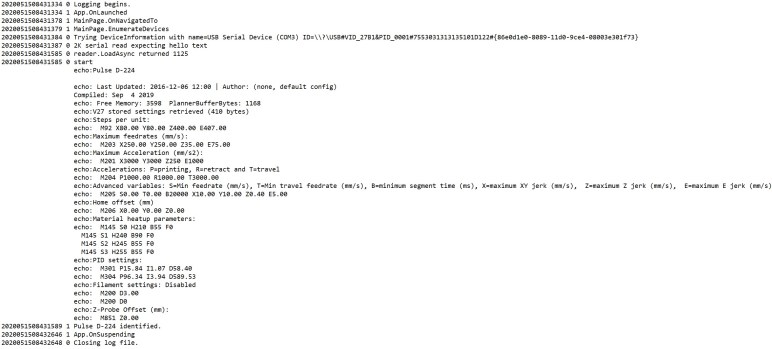
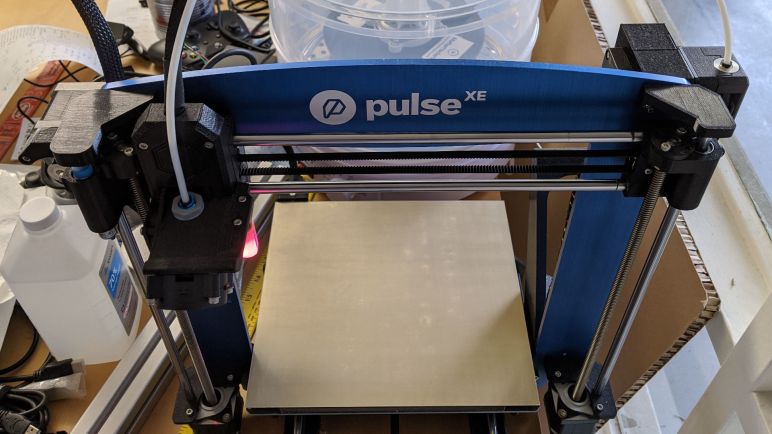
I chose to experiment with UWP serial device communication with my 3D printer because (1) it sends out a sequence of text immediately upon connection and (2) it was already sitting on the table. Just trying to read that text was an educational exercise, including a side trip through the world of logging.

The next obvious step was to send a command and read the printer’s response. This is where I learned 3D printers like this MatterHackers Pulse XE behaves a little differently from serial devices I’ve worked with before. RoboClaw motor controllers or serial bus servos like the Dynamixel AX-12 or LewanSoul/Hiwonder LX-16A have one behavior in common: They listen for a command in a known format, then they send a response also in a known format. This isn’t what my 3D printer control board does.

It wasn’t obvious to me until in hindsight, but I should have known as soon as I saw it send out information upon connection before receiving any commands. That’s not the only time the printer would send out unprompted information. Sometimes it sends text about SD card status, or to indicate it is busy processing the previous command. Without a 1:1 mapping between command and response, the logic to read and interpret printer response to commands has to be a little more sophisticated than what I’ve needed to write for earlier projects.

Which is a great opportunity to learn how to structure my code to solve problems with the async/await pattern. When I had a strict command/response pattern, it was easy to write code that assumes the information I read is in direct response to the command I sent. Now that data may arrive unprompted, the read and write operations have to be separated into their own asynchronous processing loops. When the read loop receives data, it needs to be able to interpret that possibly in the absence of a corresponding command. But if there is a corresponding command, it needs to pair up the response with the command sent. Which meant I needed a queue of commands awaiting responses and logic to decide when to dequeue them and send a response back to their caller.

Looking at code behavior I can see another potential: that of commands that do not expect a corresponding response. Thankfully I haven’t had to deal with that combination just yet, what I have on hand is adding enough challenge for this beginner. Certainly getting confusing enough I was motivated to extended my logging mechanism to help understand the flow.

[The crude result of this exercise is available publicly on GitHub]

What To Do When Await Waits Too Long

I had originally planned to defer learning about how to cancel out of an asynchronous operation, but the unexpected “timeout doesn’t time out” behavior of asynchronous serial port read gave me the… opportunity… to learn about cancellation now.

My first approach was hilariously clunky in hindsight: I found Task.WhenAny first, which will complete the await operation if any of the given list of Task objects completed. So I built a new Task object whose only job is to wait through a short time and complete. I packed it and the serial read operation task together into an array, and when the await operation completed I could see whether the read or the timeout Task completed first.

It seemed to work, but I was unsatisfied. I felt this must be a common enough operation that there would be other options, and I was right: digging through the documentation revealed there’s a very similar-sounding Task.WaitAny which has an overload that accepts a TimeSpan as one of the parameters. This is a shorter version of what I did earlier, but I still had to pack the read operation into a Task array of a single element.

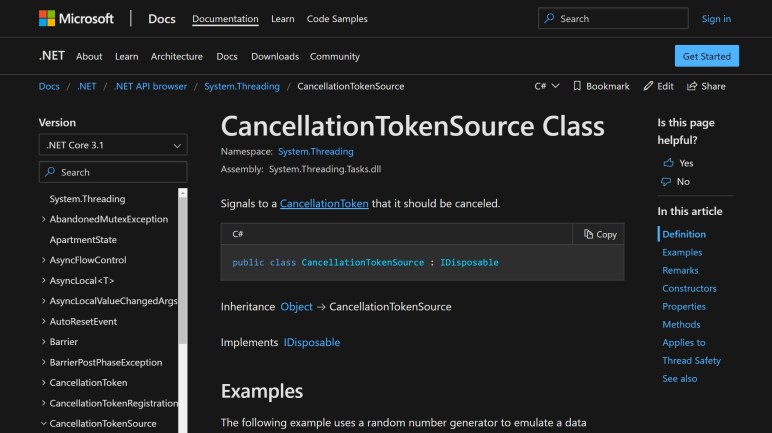
Two other overloads of Task.WaitAny accepted a CancellationToken instead, and I initially dismissed them. Creating a CancellationTokenSource is the most flexible way to give me control over when to trigger a cancellation, but I thought that was for times when I had more sophisticated logic deciding when to cancel. Spinning up a whole separate timer callback to call Cancel() felt like overkill.

Except it didn’t have to be that bad: CancellationTokenSource has a constructor that accepts a count of milliseconds before canceling, so that timer mechanism was already built-in to the class. Furthermore, by using CancellationTokenSource, I still retain the flexibility of canceling earlier than the timeout if I should choose. This felt like the best choice when I only have a single Task at hand. I can reserve Task.WhenAny or Task.WaitAny for times when I have multiple Task objects to coordinate. Which is also something I hope to defer until later, as I’m having a hard enough time understanding all the nuances of a single Task in practice. Maybe some logging can help?

[This Hello3DP programming exercise is publicly available on GitHub]

Unexpected Behavior: Serial Device Read Timeout Only Applies When There’s Data

After playing with the Custom Serial Device Access demonstration application to read a 3D printer’s greeting message, I created a blank C# application from the Universal Windows Platform application template in Visual Studio and copy/pasted the minimum bits of code to read that same printer greeting message and send it to text on screen.

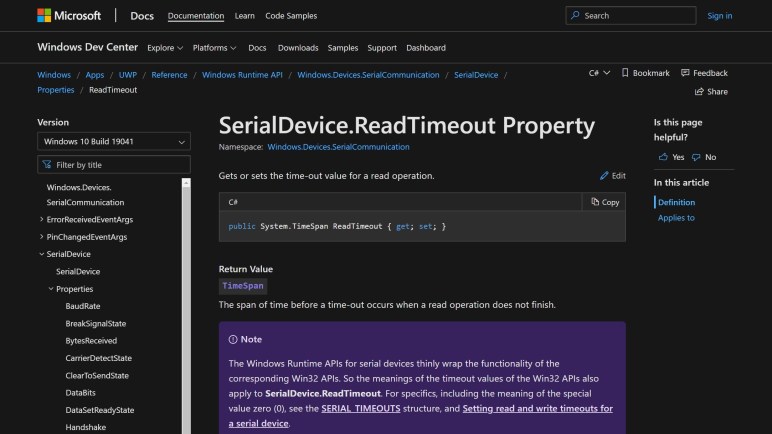
The sample application only showed a small selection of text, but I wanted to read the entire message in my test application. This is where I ran into an unexpected behavior. I had set the SerialDevice.ReadTimeout property to various TimeSpan on the scale of a few seconds. Sometimes I would get the timeout behavior I expected, returning with some amount of data less than buffer size. But other times my read operation hangs indefinitely past the timeout period.

I thought I did something wrong with the async/await pattern causing me to await forever, but I cut the code way back to the minimum while still following the precedence of the sample app, and it was still happening unpredictably. Examining the data that was returned, it looked like the same greeting message I saw when I connected via PuTTY serial terminal, nothing to indicate a problem.

Eventually I figured out the factor wasn’t anything in the data I have read, but the data I have not yet read. Specifically, the hanging behavior occurs when there is no further data at all from the serial port waiting to be read. If there was even just one byte, everything is fine: the platform will pull that byte from the serial port, put it in my allocated buffer (I experimented with 1 kilobyte size buffer, 2 KB, 4KB, it didn’t matter) and return to me after the timeout period. But if there are no bytes at all, it hangs waiting.

I suppose this makes some sort of sense, it’s just not what I had expected. The documentation for ReadTimeout mentions that there’s an underlying Win32 data structure SERIAL_TIMEOUTS dictating underlying behavior. A quick glance through that page failed to find anything that corresponds to what I think is happening, which worries me somewhat. Fortunately, there are ways to break out of an await that has waited longer than desired.

[This Hello3DP programming exercise is publicly available on GitHub]