Samsung 500T Unexpected Power Consumption Caused By Patch Tuesday

I’ve set up my unloved Samsung 500T tablet to display the current position of the International Space Station around the clock. This was a very steady and predictable workload for the machine, which made it the perfect solar power test subject. Since the time I devised a first draft of a strategy for maximize solar power runtime, I’ve been tweaking it as I go.

The tablet has behaved predictably over several weeks, so I could test different times to connect/disconnect from the solar panel and maximize storage time while also keeping the battery state of charge between 20% and 80% to maximize its cycle life. It’s not a very precise experiment on my end because I’ve been connecting and disconnecting power manually. An automated solution is in the future, once I’ve figured out what I want to do.

Things were going well until Tuesday of this week, when my power scheme went awry. First problem was that I neglected to disconnect power when it reached 80% SoC, that was on me. But then I ran into a second problem: the power consumption was extremely erratic after I disconnected power to the tablet (area highlighted in red.) As far as I knew, I did nothing to trigger any change in behavior, and the tablet isn’t displaying anything other than the ESA ISS Tracker. What’s going on?

The keyword is “Tuesday”, more specifically, it is the second Tuesday of the month when Microsoft pushes out security updates for Windows. On my other Windows computers, Patch Tuesday takes only a few minutes to download and install. But the Samsung 500T is so slow, patch installation is a drawn-out multi-hour affair. During which it consumes significantly more power than just displaying the ESA ISS tracker.

This episode reminds me of the value of long term testing, and that my Samsung 500T solar power strategy will need to allocate more power on the second Tuesday of the month.

Initial Solar Power Strategy for Samsung 500T

I foresee a lot of refinement ahead for optimizing how to run my Samsung 500T (displaying ESA ISS tracker) on solar power as much as possible using its internal battery. But I have to start somewhere, thus this first plan as starting point.

To improve battery cycle life, I want to keep its state of charge (SoC) between 20% and 80% which should be fairly straightforward to put into a program. That’s just the easy part, the harder part is optimizing for solar power by trying to keep the charging periods as much as possible during times when panels are delivering energy. And it wouldn’t be possible do use internal battery capacity around the clock because that “middle 60%” of the battery is not enough to take the tablet all the way through the night. So it will need to draw upon the lead-acid array sometime overnight but that should be kept as low as possible.

Accomplishing this goal will require optimizing for both ends of the period when solar power is available. In the late afternoon, power should be connected to get up to 80% SoC just as the sun goes down, which requires knowing when sunset will be. During the late-night feeding, the tablet should be given just enough power to leave it at 20% SoC when the sun is back up, which requires knowing when sunrise will be. Add to this seasonal variability other random factors like rainy days, and we have a pretty complex power management challenge on our hands.

Right now 60% of power can keep the tablet running for approximately 9 hours, a number that I expect to shrink as the battery degrades in the future. That inevitable degradation is, in fact, part of the experiment! But right now that means we need a little less than three discharge-charge cycles per day. According to cycle life chart at Battery University, 80% SoC is near the optimal trade off point between cycle life and capacity. But if don’t need three full cycles, we can prolong battery cycle life even further by charging to some level less than 80%, just enough to make it to the next event.

With those considerations, here’s the initial daily charging plan:

  1. The most important cycle is the one just before sunset bringing the battery up to 80%. This maximizes the solar energy captured for running when there’s no direct solar energy.
  2. The following charging cycle will occur sometime overnight. It does not need to get all the way up to 80%, the goal is to give the tablet just enough to leave it with 20% by the time solar panels are delivering power again. When should this charging cycle start and where it should end is yet to be determined.
  3. After the sun starts shining, we’ll need another charging cycle to bring the battery back up via solar power. Ideally we charge up to 80% SoC and stay there until sunset, but we don’t have the means to control that. So we’ll charge just enough to leave us with 20% by the time of the sunset charge (#1 above).

Depending on the amount of sun available, charge cycles #2 and #3 should halt before reaching 80%, which should help prolong battery life. This plan was my starting point to run a multi-week experiment using different strategies, as well as finding unexpected perturbations I’ll have to account for.

Approaches to Optimizing Samsung 500T For Solar Power

My Samsung 500T solar power project is an exercise to maximize a battery’s ability to help store and use solar power by creating a usage regimen maximizing its cycle life. I’m doing this on the 500T because it was available and I wouldn’t cry too much if I make a mistake ruining it. Hopefully ruination is unlikely, as I plan to leave the built-in battery management circuit intact to save me from drastic mistakes.

According to Battery University, best longevity of lithium batteries comes when they avoid the stress of either end of their capacity. This means avoiding charging to full, and avoiding discharging to empty. A common approach is to charge until 80% and no further, leaving 80% – 100% unused. And when discharging, go no lower than 20%, leaving 20% – 0% unused. Using just the “middle” 60% means the battery would have to go through almost twice as many charge/discharge cycles to deliver the same overall energy, but doing so is rewarded with a battery that can survive much more than twice the number of cycles so we come out ahead.

Maintaining such a protective regimen is a hassle that isn’t usually worth the trouble for consumer electronics, because they’re usually replaced within a few years for reasons other than battery degradation. But such maintenance is done for batteries intended for longer lifespan, like those on satellites and electric cars. My 2012 Chevy Volt does this in a way transparent to the driver: When my car told me the battery is empty, it’s actually somewhere around 20% and when it told me the battery is full, it’s actually roughly 80%. The Samsung 500T does not do this, which we could verify by watching both the proclaimed charge percentage and its actual voltage.

Handling the low end should be easy – watch for the charge percentage to drop to 20% and connect power to lead acid array for charging. The high end is a little trickier. Ideally I could attach power to the 500T and charge it slowly up to 80% during daylight hours, but I don’t have that kind of control. When I connect power, it will charge to 100% as fast as it could. I could only cut power at 80% charge to avoid going into the upper 20%. This means we’ll end up with an extra discharge cycle during the day, but if the overall power regimen actually improves cycle life by more than triple, it will still be a worthwhile trade off.

Constraints on Optimizing Samsung 500T For Solar Power

I monitored a battery discharge and recharge cycle on a Samsung 500T to get a feel on how it can be a better partner in my mini solar system. Right now it is constantly plugged in to the lead-acid battery array, leaving its own internal battery constantly full. I want to make use of that battery capacity to help store solar power for the 500T’s current task of displaying ESA’s space station tracker.

For this first draft I want to avoid cracking the computer open, which means I don’t have any control over the charging algorithm. It will charge at full speed whenever I connect power, and it will try to charge to 100%. Charging to full is stressful for lithium ion batteries and decreases their lifespan. Some computers offer the ability to halt charging at 80% reducing use of capacity in exchange for extending the usable life of the battery. Unfortunately I saw no such option with the 500T.

The discharge rate is also pretty much fixed, as I’ve turned off all I can of Windows and Samsung crapware. Leaving just the ISS tracker and Node-RED running. About the only parameter I can adjust is the rate at which Node-RED queried data, and I think I can back off from once per minute to maybe once per three or five minutes. This will help a tiny bit.

The good news is that, watching through the data retrieved by Node-RED through a discharge and charge cycle, I see nothing worrisome about that data and willing to trust it. With data in hand, there are two more things to bring in to the picture: (1) a switch for the tablet’s power cord to my lead acid batteries, and (2) a program to connect/disconnect that power at the best times to optimize the system. I want to think over the latter before I spend money on the former.

Monitoring Samsung 500T Discharge-Charge Cycle

Getting through Node-RED installation on my Samsung 500T tablet was the hard part. Once done, it was trivial to set up a flow to extract the tablet’s battery voltage and charge percentage. I didn’t want to add any more overhead than I already have, so the flow sends that data off to a MQTT broker. Allowing me to analyze that data on a different computer without impacting the battery consumption on the 500T.

It was instructive to watch those two graphs after I unplugged the 500T, charting its battery discharge down to under 10% followed by a charge back up to 100%. During this time, the 500T kept its screen on displaying ESA’s ISS Tracker, plus the normal Windows background tasks. And now it also has Node.JS running Node-RED to query the battery voltage and charge percentage.

The first observation is that the battery discharge percentage graph is impressively linear. As a user I never felt this way intuitively, as my most memorable episodes are battery meters whose value seem to drop faster and faster as I raced to finish a task before my battery gave out. A linear graph is impressive because a lithium ion battery’s discharge voltage is not linear, something we can see on the voltage graph. It drops sharply off 8.4V before stabilizing on a gentle slope that’s more like a curve as it gradually slowed approaching 7.4V. (That is the commonly listed nominal voltage level for two lithium ion battery cells in series.) Once it dips below 7.4V, voltage curve starts dropping rapidly and trending towards a steep dive when I plugged the 500T back in to a power source. We can also see that the voltage level is a bit noisy, fluctuating as it discharges. In contrast, except for a little dip off 100%, the percentage graph is steadily and reliably decreasing under a constant workload. Just as we’d expect, with no surprises. I have a lot of complaints about this machine, but its power management is rock solid.

For the charge cycle, again the percentage value is not based solely on battery voltage as we see those two are wildly divergent during charging. When I plugged in to recharge, there was a big jump upwards as the machine switched to charging cycle. Towards the end of that cycle as charge state approached 100%, there was some kind of a top-off procedure. I was surprised to see that charge controller allowing the battery voltage to exceed 8.4V, something I’ve been taught to never do when charging bare 2S LiPo battery packs. But according to this voltage graph, exceeding that voltage was part of the process of filling the battery before letting it settle down to around 8.35V. All through this top-off procedure, the battery percentage reported 100%.

I enjoyed this opportunity to geek out over battery management minutiae, but it isn’t just for curiosity’s sake. There was a project idea behind all this.

Installing Node-RED on Samsung 500T

When I saw that Node-RED community contributions included a general battery state-of-charge reporting node, I thought that would be a practical and useful first step into playing with contribution nodes. I wanted to give that specific ndoe a try because given my past miserable user experience on my Samsung 500T tablet, I was not terribly motivated to put in the effort required to write my own code to extract battery information. But I’m willing to see if that Node-RED node can work its magic here, and the first step of is, obviously, see if we can even install Node-RED on the unloved machine.

There were many reasons to be pessimistic. Windows was and is still seen as a second-class citizen in many web-centric products. And not only is the tablet running Windows, it is stuck on an old version of Windows because of the whole Intel Clover Trail mess preventing modern Windows 10 support. Furthermore, Clover Trail is a 32-bit only chip without support for x86-64 a.k.a. amd64 instructions that are starting to become a requirement on modern software frameworks. And it only has 1GB of RAM. And we’re still dealing with that molasses-slow eMMC storage. The list goes on.

Fortunately Node.JS still has a 32-bit Windows installer, though installation failed after nearly an hour of grinding away. I was first disappointed but then relieved to see it was “merely” a timeout installing one of the auxiliary components. This was not a huge surprise given how slow this machine is, so I waited for the system to settle down (lots of backlog waiting on that eMMC) before retrying. Node.JS installation succeeded the second time and after that I installed Node-RED without drama.

Launching Node-RED faced another unnecessary hurdle in the form of Windows Firewall. Annoyingly, this was one of the differences between Windows 1607 and modern builds, so I had none of the menu options I’ve become familiar with. But eventually I was able to let Node.JS open up a port to serve the Node-RED user interface, where I could install node-red-contrib-battery.

I dropped three nodes into the blank flow: an inject node, a debug node, and the newly installed battery node between them. I hit “Deploy” and clicked to see if that battery node can extract any information and… it can! Not a lot, as most of the fields are blank or null, but it did return the current battery voltage and the charge percentage. This is all I need to observe this tablet’s charge and discharge behavior.

Node-RED Challenge Round 1: Battery Level Reporting

When I discovered Node-RED and its vast library of community contributions, I checked for several pieces of functionality that might enable several different projects ideas on my to-do list. One of them was the ability to query battery discharge level on a computer.

This was a follow-up to my earlier project assigning a Samsung 500T tablet to display an ISS track around the clock. When I last left that project, I modified the tablet so it runs on my small solar power array. But the arrangement was not optimal: the tablet is constantly pulling power from the array storage battery, instead of contributing its own battery to help store solar energy.

I had the thought to integrate that battery in an automated fashion. There are several ways it could go, but an important data point is battery discharge level. It is the key piece of information in any algorithm’s decision to charge the tablet during the day and let it run on battery at night.

This is something I knew I can accomplish by writing a bit of code. I need to find the APIs to query battery level, then I need to write code to extract that information and do something with it. None of that were technically challenging tasks, but I never allocated the time to do it.

Now I have Node-RED and its library of tools, which included node-red-contrib-battery purported to report battery information in a common way across Linux, MacOS, and Windows. If it works as advertised, all that battery query coding I kept putting off could be as simple as hooking up some nodes. It’s definitely worth trying.

Samsung 500T Now Runs On Solar Power

I wanted to have a screen in my house displaying current location of the international space station. I love ISS-Above but didn’t want to dedicate a Raspberry Pi and screen, I wanted to use something in my pile of retired electronics instead. I found ESA’s HTML-based ISS tracker, tested it on various devices from my pile, and decided the Samsung 500T would be the best one to use for this project.

One of the first device I tried was a HP Mini (110-1134CL) and I measured its power consumption while running ESA’s tracker. I calculated my electric bill impact to keep such a display going 24×7 would be between one and two dollars a month. This was acceptable and a tablet would cost even less, but what if I could drop the electric bill impact all the way to zero?

Reading the label on Samsung 500T’s AC power adapter I saw its output is listed at 12V DC. The hardware is unlikely to run on 12V directly, since it also has to run on batteries when not plugged in. It is very likely to have internal voltage regulators which should tolerate some variation of voltage levels around 12V. The proper way to test this hypothesis would be to find a plug that matches the AC adapter and try powering the tablet from my bench power supply. But I chose the more expedient path of beheading the AC adapter instead and rewiring the severed plug.

A quick test confirmed the tablet does not immediately go up in flames when given input voltage up to 14.4V, the maximum for lead-acid batteries. Whether this is bad for the device long term I will find out via experience, as the tablet is now wired up to my solar powered battery array.

This simple arrangement is constantly keeping tablet batteries full by pulling from solar battery. This is not quite optimal, so a future project to come will be to modify the system so it charges from solar during the day and runs on its own internal battery at night. But for now I have an around-the-clock display of current ISS location, and doing so without consuming any electricity from the power grid

Samsung 500T Disappointments

I pulled out my old Samsung 500T to see if it could run ESA’s ISS tracker. It could, and quite well, so I think the role might be the best use of this machine. Because it has proven to be a huge disappointment in so many other ways.

I knew of the machine when it launched alongside Windows 8. This was when Microsoft also launched the original ARM-powered Surface tablet to demonstrate what’s possible by using ARM chips: look at how thin and light they are! Samsung & friends launched the 500T as counterpoint: just as thin and light as the Windows RT tablets, but with an Intel CPU for full x86 compatibility. Judging by the spec sheet, it was a spectacular device to undercut and humiliate the “Windows on ARM made thin and light possible” story.

But that’s only on the spec sheet and not on the price tag. The 500T was expensive and Surface tablets sold for far less. Due to that fact, I didn’t get my 500T until much later when it showed up as a secondhand refurbished unit on Woot. When it arrived, I was sure there was something wrong with the machine. Maybe it somehow slipped past testing in refurbishment? It was completely unusable, taking several minutes to boot and user commands took many seconds (5-10) to respond or were ignored entirely. I went online and found a firmware update, which took all night to apply and upgraded performance from “disastrous” to “merely horrible”.

The screen was another cool feature that didn’t panned out. Not just a touchscreen for fingers, it was also a pen digitizer. Compatible with passive Wacom stylus used by the much thicker Surface Pro tablet, the 500T also had a tiny stylus holder built in. It held the promise to be a digital sketchpad with pressure sensitivity making it superior to a contemporary iPad. But slow system response killed that dream. Who wants to sketch on a pad when strokes don’t show up until a few seconds after we draw it?

Judging by Windows Task Manager, this device’s major implementation flaw was its eMMC flash storage, constantly showing 100% activity. The Atom CPU was not exactly a stellar performer, but it wasn’t the reason for delay as the 500T was constantly waiting to read from or write to storage. Generally ruining user experience across the board.

Not to let Intel entirely off the hook, though, as its Atom Z2760 CPU turned out to be a long term liability as well. This CPU was part of Intel’s Clover Trail family, and they had problems running Windows 10 features newly introduced in 2016. Intel had discontinued that line and declined to do anything about it, so Microsoft blocked Clover Trail devices from advancing beyond Windows 10 build 1607. They will still receive security fixes until January 2023, but features are stuck at July 2016 levels forever.

All of the above are things that I might be able to overlook as unfortunate result of things outside Samsung’s control. The eMMC storage might have performed well when new but degraded with time as solid state storage sometimes do. (The TRIM command could help, but they had to make use of it.) And Samsung had no way of knowing Intel would just abandon Clover Trail.

But let’s talk about what Samsung have chosen to install on the machine. As is typical of machines around that age, there was the usual useless bucket of trials and discount offers. There are also Samsung features that duplicate existing Windows functionality, others thinly veiled advertisement for Samsung products, and more. The worst part? I could not get rid of them. I thought they would be gone once I wiped and installed Windows 10, but they were bundled with critical device drivers so I had no choice but to reinstall them as well. Holding device drivers hostage to force users to accept unrelated software is consistent with Samsung’s anti-user behavior I saw across the board.

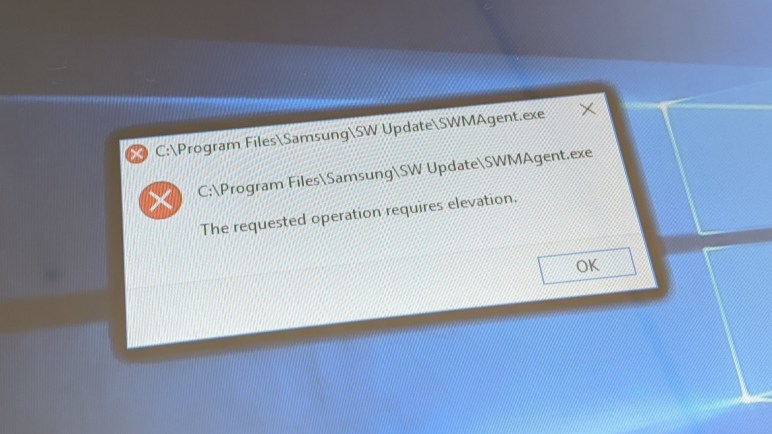
The image at the top of this post is just one example. SWMAgent.exe appears to be some sort of Samsung software update engine (What’s wrong with Windows Update?) and it asks for elevation. If the user declines to grant elevated privileges, the software is supposed to respect that choice and go away. But not Samsung! We see a black border visible around that dialog box, which might look strange at first glance. Windows 10 adds a subtle dark shadow to dialog boxes, why this ugly black thing? It is because we’re not looking at a single SWMAgent.exe dialog box, but a huge stack of of them. Each popping on top of the last, and another one added every minute or so. The thick black border is a result of that subtle dark shading stacked deep and combining, because Samsung would not take no for an answer.

I don’t need that in my life. The upside of this machine being disappointing was that I had no motivation to put up with it. Into the unused bin it went, and I haven’t bought a Samsung computer since.

ESA ISS Tracker on Samsung 500T

Setting aside the HP Stream 7 as unsuitable for my current project, we reach the final piece of x86 Windows hardware in my pile of unused devices: the Samsung 500T. I guess 500T was a shorthand for its full designation XE500T1C, though I don’t think it made the name roll off the tongue much easier.

This device has a 11.6 inch diagonal touchscreen. It was designed for Windows 8 and launched at around the same time. Its primary focus is on tablet workloads, but can become a convertible tablet/laptop like the HP Split X2 with purchase of an optional keyboard base. Since the keyboard is optional, the 500T has more peripherals packed along its edges. Not just the microSD expansion slot like the HP but also a full-size type A USB and micro HDMI connectors. HP delegated the latter tasks to its included base, which has two type A USB ports and a full sized HDMI connector.

As a piece of Windows 8 hardware like HP Split X2 and HP Stream 7, the 500T has a Windows license in embedded hardware. Thus I was also able to install Windows 10 erasing the existing installation of Windows 8 which was protected by a password I no longer remember. Once device drivers were installed, all features functioned as expected including the ability to run on plug-in power and charge its battery.

That capability was inexplicably nonfunctional in my HP Stream 7. Which meant unlike the HP Stream 7, I could run this display continuously on wired power around the clock. And showing the ESA HTML live space station tracker might be the best way to make use of this hardware. It would be a better end than collecting dust, as my past experience of this tablet has failed to live up to its potential and generally soured me on buying any more computers from Samsung.